
QMU Travel Survey 2024/2025
1.1 Introduction
Queen Margaret University (“QMU”) has been undertaking annual commuting travel surveys since 2008, with the results published on the University website. Travel surveys are used to monitor emissions, changing travel habits, gather feedback on facilities and to promote campus services. The data from the travel survey is used to inform future targets and allocation of resources and to calculate Scope 3 emissions relating to transport.
As QMU’s Transport Planner Coordinator (“TPC”), Sweco was responsible for designing, promoting and analysing the 2024/25 travel survey. The results have been compared with previous years’ results, to identify changing trends.
Several measures have been implemented following the 2023/24 travel survey to improve sustainable travel on campus. An outline of these measures as well as those being brought forward this year are provided in Chapter 4.
For 2024/25, the travel survey was live for a 6-week period from Monday 23 March to Monday 5 May.
A shortened travel survey was distributed this year to mitigate survey fatigue and to try to improve the low response rate which was experienced in the 2023/24 travel survey. A decision was made to conduct a comprehensive survey every three years, with interim surveys featuring fewer questions.
To encourage uptake of the survey, it was actively promoted via Moderator throughout. Additionally, a poster was created which contained a QR code to the survey. Copies of this poster were distributed across the QMU campus including to the Student Union and Maggie’s. Additionally, a digital copy of the poster was created and was featured on rotation in the various TV screens around the University for a number of weeks, as shown in Figure 1-1. Screens were located in locations like Maggie’s, the main entrance, the Resource Centre and in staff areas. In the final week before the survey closed, smaller leaflets were printed and left in high trafficked areas. A copy of the travel survey poster can be seen in Appendix A.

Figure 1.1: Travel survey displayed on University entrance screen
The travel survey was also promoted at the Secure Your Bike event which took place on campus on Wednesday 9 April 2025, as show in Figure 1-2.

Figure 1.2: Travel survey being promoted at event
To further incentivise participation in the travel survey, respondents who participated were entered into a prize draw for a £50 Amazon voucher.
The survey was completed by 145 respondents, representing a 3% response rate across the University population. The University role split (staff or student) of those who responded to the survey can be viewed in Figure 2-1.
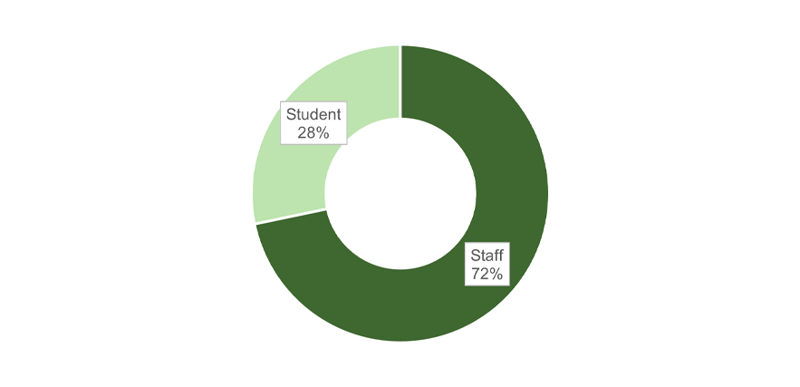
Figure 2.1: University role split of respondents
72% of survey respondents (104 people) were staff which represents a 17% response rate amongst staff, the total staff population is 607. The student population is made up of a mixture of online and in-person learners. Of the 4,813 students that are based on-campus for their studies, 41 students completed the survey which represents only a 1% response rate amongst students.
The results presented from the survey hereafter should treated with caution due to the low response rates and small sample relative to the University's total population. Sample bias could be an issue (particularly for students), as those who participated might not accurately represent the broader University population. This can misrepresent actual travel behaviours and opinions across the campus. Additionally, some individual questions were only answered by a handful of respondents (again, particularly for students), which leads to reduced statistical reliability. As a result, the data might lack the robustness needed for confident decision-making. Non-generalisable findings mean that any conclusions drawn should be seen as preliminary indicators rather than definitive truths.
A comparison of frequency of travel to the University between staff and students can be viewed in Figure 2-2. The most common frequency of travel to the University for both roles is three days per week, with 33% of staff and 29% of students commuting at this frequency. It is more common for staff to travel to the University five days per week (24%) and students tend to have more infrequent travel patterns with 5% commuting once per month and 2% every few months.
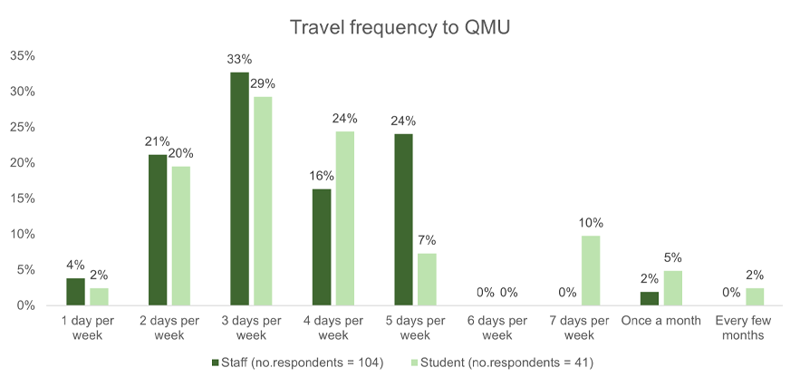
Figure 2.2: Travel frequency to the University for staff and students
In June of 2025 the University announced its updated Draft Hybrid Working Policy. This states that staff are expected to spend at least 50% of their contracted hours working from campus.
The main modes of travel used by staff and students can be viewed in Figure 2-3. For staff, car driver is the main mode recorded, with a 41% mode share, followed by train at 22%. It is more common for students to use public transport as their main mode, train is the most common mode at 28% and bus at 23%. Additionally, students are more likely to walk, wheel, or run to the University (15%) compared to staff (9%), while staff are more inclined to cycle (14%) than students (5%).
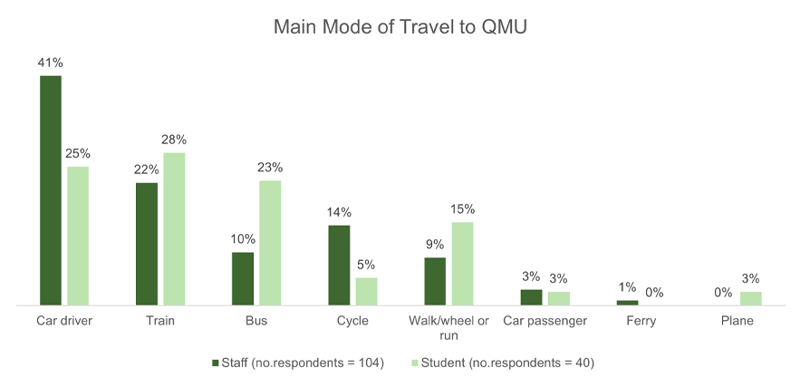
Figure 2.3: Main mode of travel comparison between staff and students
Table 2-1 provides a breakdown of commuting distances by main mode of travel. As can be viewed, the average distance travelled by those using a car as their main mode was 22 miles and there is a wide range between the minimum (2 miles) and maximum (110 miles) distances travelled. As such the median distance travelled by car is 12 miles. Those cycling to the University as their main mode, on average, travel further than those by bus (6 miles vs 5 miles) and those walking as their main mode travel a maximum distance of 5 miles. Please note that the distances listed in Table 2-1 represent the total journey distance categorised by main mode of travel. Therefore, respondents may have travelled these distances using one or more modes of travel.
Table 2-1: Journey distance by mode
| Main Mode | Average Distance | Median Distance | Minimum Distance | Maximum Distance |
|---|---|---|---|---|
| Car (driver or passenger) | 22 miles | 12 miles | 2 miles | 110 miles |
| Train | 20 miles | 13 miles | 3 miles | 60 miles |
| Bus | 5 miles | 5 miles | 2 miles | 13 miles |
| Cycle | 6 miles | 6 miles | 2 miles | 13 miles |
| Walk / Wheel / Run | 1 mile | 1 mile | <1 mile | 5 miles |
Table 2-2 shows the average percentage of the total journey to the University that respondents use their main mode. It shows that both staff and students that travel to the University by car as their main mode tend to only use one mode. Conversely, those travelling by public transport (bus or train) are more likely to undertake multi-modal journeys, with approx. 10-15% of their journey being undertaken via another mode. Additionally, those travelling actively (cycle or walk/wheel or run) as their main mode tend to not undertake multi-modal journeys, as may be expected.
Table 2-2: Mode by role
| Main Mode | Staff | Students |
|---|---|---|
| Car driver | 98% | 100% |
| Car passenger | 100% | 100% |
| Train | 88% | 85% |
| Bus | 88% | 90% |
| Cycle | 100% | 100% |
| Walk / Wheel / Run | 100% | 99% |
2.3.2 Secondary Mode
Secondary modes of travel can be viewed in Figure 2-4. Staff (48%) and students (37%) most commonly only use one mode of travel to the University. Walking, wheeling or running is the most common secondary mode, followed by public transport options.
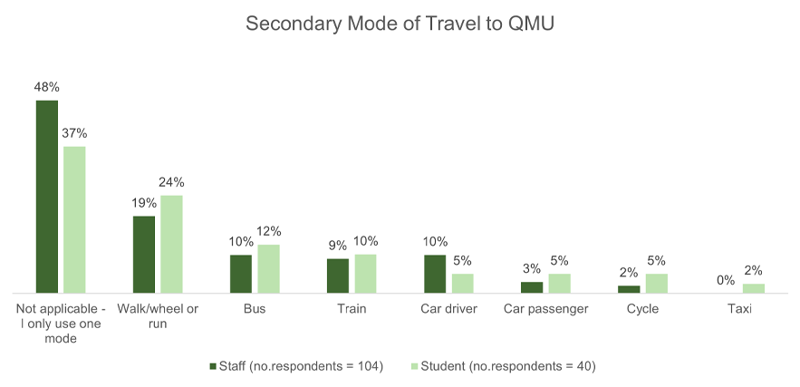
Figure 2.4: Secondary mode of travel comparison between staff and students
Further analysis of the data found that those walking, wheeling or running as their secondary mode tend to use public transport as their primary mode. 90% of the 30 respondents that walk, wheel or run as their secondary mode use public transport (bus or train) as their main mode.
Figure 2-5 shows a mode share comparison from the last three travel surveys. Walking/wheeling or running to the University has seen a steady decline over the last three years, decreasing by 6 percentage points from 2022/23 figures. The cycling mode share has stayed relatively stable at approx. 12% and train travel has increased by 8 percentage points since last year. Despite the recent introduction of free bus travel for people under-22 to encourage sustainable travel, the survey has revealed a decline in bus usage over the past three years. Car driver has increased again since 2023/24 by 3 percentage points to 37%.
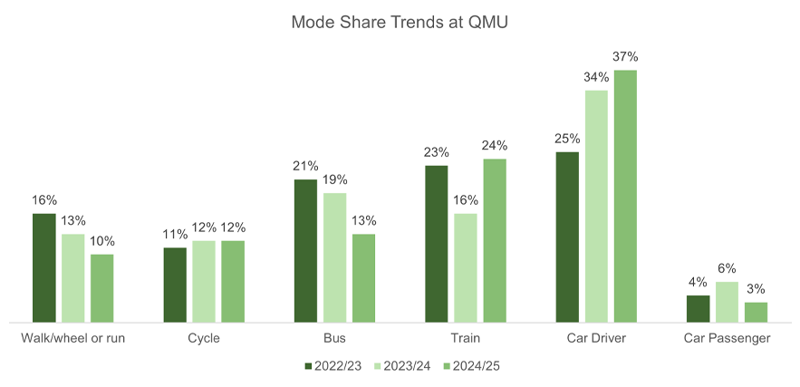
Figure 2.5: Overall University mode share trends for last 3 years
Figure 2-6 shows more generalised mode share trends for active travel, public transport and car travel over the previous six years. The active travel mode share has seen an increase since last year (increasing to 22%) but is 12 percentage points off its highest mode share (34%) in 2020/21. Public transport also appears to be making a small but steady decline since 2019/20, however there has been a slight increase of 2 percentage points since last year, now sitting at a 37% mode share for 2024/25. Car travel shows an increasing trend since 2019/20 and sits at 40% for 2024/25 which is the same value recorded for last year also.
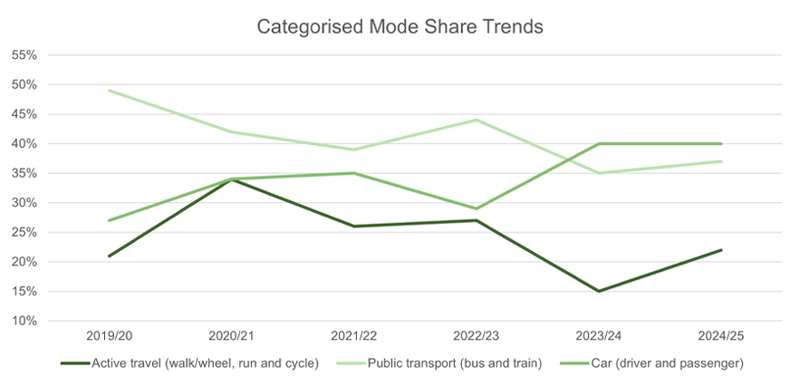
Figure 2.6: Categorised mode share trends
Lastly, Figure 2-7 shows a mode share comparison between 2024/25 mode share values for the University and results from the latest available Scottish Household Survey (2023 statistics). Values for the East Lothian region are shown along with the Scottish average.
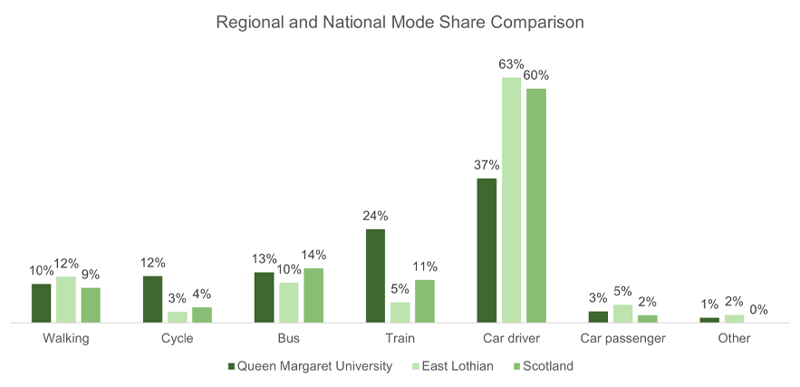
Figure 2.7: Mode share comparison between the University (using 2024/25 values), East Lothian and Scottish averages (from the Scottish Household Survey 2023)
Levels of walking are relatively similar to that of East Lothian and Scotland at the University, whereas cycling is significantly greater at 12% compared to 3% for East Lothian and 4% for Scotland. Train travel is significantly greater at the University, likely due to the convenient location of Musselburgh station next to the University. Compared to East Lothian and Scotland, car driver has a much lower mode share at the University 37% compared to 63% for East Lothian and 60% for Scotland.
Since 2023/24, the percentage of those commuting to the University by foot has increased for both staff and students, as indicated in Table 2-3. For staff it has increased by 4 percentage points and for students almost quadrupled from 4% in 2023/34 to 15% in 2024/25.
Table 2-3: Walking / Wheeling mode share
| Year | Staff Mode Share | Student Mode Share |
|---|---|---|
| 2020/21 | 1% | 14% |
| 2021/22 | 11% | 5% |
| 2022/23 | 5% | 2% |
| 2023/24 | 5% | 4% |
| 2024/25 | 9% | 15% |
On average people who walk/wheel or run as their main mode travel for an average of one mile. The minimum distance covered is under one mile while the maximum is five miles.
Respondents were asked to rate walking/wheeling routes to the University. Overall, on a scale of 1 (very poor) to 5 (very good), staff gave an average rating of 3.7 while students rated slightly less at 3.6. A breakdown of ratings can be viewed on Figure 2-8.
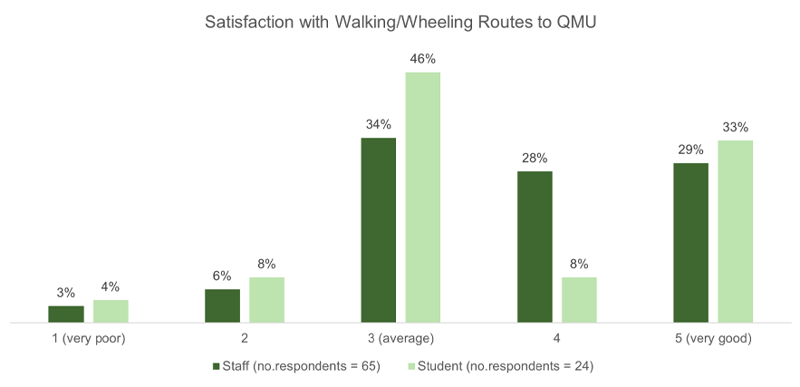
Figure 2.8: Satisfaction with walking and wheeling routes to the University
As can be viewed, the greatest proportion of both staff and students scored walking/wheeling routes to the University as average (rating of 3).
Several comments were left in the free-type response section at the end of the travel survey regarding walking/wheeling by survey respondents and have been summarised into the following categories:
- Weather and safety conditions – walking is pleasant during spring, summer, and autumn but can be hazardous when icy. There are concerns about the surface of walkways having no grip in icy conditions.
- Interactions with cyclists – there is confusion and frustration among pedestrians regarding which side to walk on the shared cyclist and pedestrian routes, leading to conflicts with cyclists.
- Accessibility and convenience – walking is sometimes used as part of a longer commute involving public transport but carrying heavy items while walking can be difficult.
- Infrastructure maintenance – path maintenance is crucial; issues such as overgrown bushes and mud make walking less safe and enjoyable.
Since 2020/21 the cycling mode share for both staff and students has seen a steady increasing trend, however for 2024/25 there has been a small decline. The staff mode share has decreased by 2 percentage points since 2023/24 while student mode share has more than halved to just 5%. Table 2-4 provides further details on the cycling trends.
Table 2-4: Cycling mode share
| Year | Staff Mode Share | Student Mode Share |
|---|---|---|
| 2020/21 | 4% | 3% |
| 2021/22 | 19% | 9% |
| 2022/23 | 10% | 10% |
| 2023/24 | 16% | 11% |
| 2024/25 | 14% | 5% |
On average, people who cycle as their main mode travel for an average of six miles. The minimum distance covered is under two miles and the maximum is 13 miles.
Respondents were asked to rate their satisfaction with cycling routes to the University. Overall, on a scale of 1 (very poor) to 5 (very good), staff gave an average rating of 3.7 while students gave an average rating of 2.7.
Although it is recognised a low response rate from students was received for this question, it shows a lower satisfaction rate amongst students with 22% rating routes as very poor. A breakdown of ratings can be viewed on Figure 2-9.
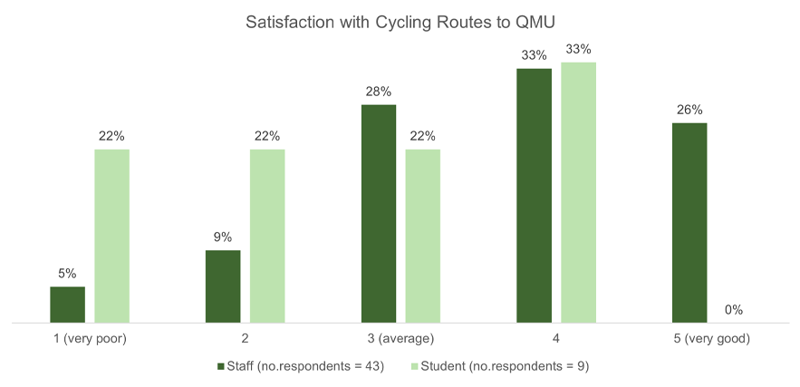
Figure 2.9: Satisfaction with cycling routes to the University
Comments from respondents in the free-type response section relating to cycling are summarised below:
Positive Remarks:
- There are decent off-road cycle routes available, which are generally appreciated.
- Cycling infrastructure has been well-developed by the University, making cycling a viable option for commuting.
- Active travel lockers and secure bike storage are considered useful for ensuring bike security.
Negative Remarks:
- There are issues with certain areas on roads, such as rutted surfaces and bad potholes, which create dangerous conditions for cyclists.
- Lack of clear information and signage for cyclists, especially concerning whether they can ride bikes on certain pavements, leading to confusion and safety concerns.
- Cyclists often face conflicts with pedestrians about which side to cycle on shared paths.
Suggestions for Improvement:
- More advice on cycle routes and safety is needed to support cyclists better.
- Better showers in changing rooms could enhance the cycling experience for commuters.
- Regular maintenance of cycle paths and addressing overgrown bushes, mud, and other impediments are crucial for safe cycling.
The mode share for staff bus travel has remained relatively steady over the past four years, as indicated in Table 2-5, but has seen its greatest fluctuation (4 percentage points) between the 2023/24 and 2024/25 travel surveys. Student mode share has decreased considerably since 2023/24 (by 13 percentage points) and now accounts for 23% of their overall mode share.
Table 2-5: Bus mode share
| Year | Staff Mode Share | Student Mode Share |
|---|---|---|
| 2020/21 | 4% | 19% |
| 2021/22 | 14% | 23% |
| 2022/23 | 11% | 33% |
| 2023/24 | 14% | 36% |
| 2024/25 | 10% | 23% |
Respondents were asked to rate the quality of bus services to the University. Overall, on a scale of 1 (very poor) to 5 (very good), staff gave an average rating of 3.1 while students rated slightly higher at 3.5. A breakdown of ratings can be viewed in Figure 2-10.
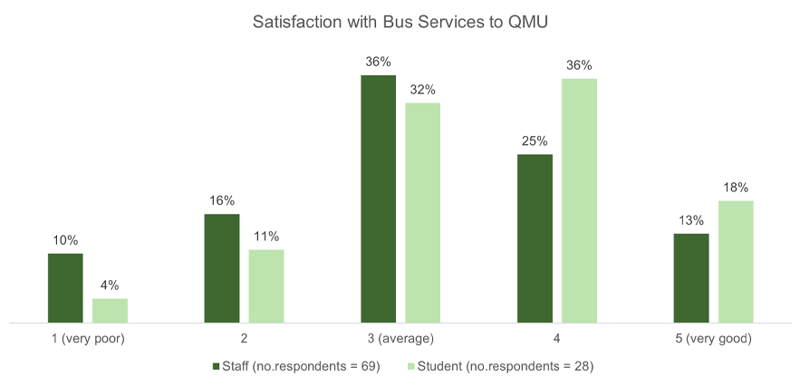
Figure 2.10: Satisfaction with bus routes to the University
People left various opinions about buses in the free-response section of the survey:
Positive Remarks:
- Some find the Lothian bus services efficient and cost-effective when using a Ridacard.
- Public transport options such as buses are considered sustainable travel options.
Negative Remarks:
- Many express frustration over the length of bus journeys compared to driving due to multiple bus changes, walking between stops or the route being less direct.
- There are complaints about inaccurate bus timings, leading to long waits in unfavourable conditions.
- Some routes meander significantly, making short distances take much longer by bus.
Suggestions for Improvement:
- More frequent and better-timed bus services are needed, especially to improve connections from key areas such as Portobello to the University.
- Express buses and more direct routes would make bus travel more viable and appealing.
As indicated in Table 2-6, train travel for staff has decreased by three percentage points since 2023/24, and it has remained relatively steady over the past three years. Student train travel has returned to levels observed in 2022/23 after a sharp drop in reported figures during 2023/24. In 2024/25, train accounts for 28% of the student mode share.
Table 2-6: Train mode share
| Year | Staff Mode Share | Student Mode Share |
|---|---|---|
| 2020/21 | 3% | 21% |
| 2021/22 | 9% | 26% |
| 2022/23 | 24% | 32% |
| 2023/24 | 25% | 7% |
| 2024/25 | 22% | 28% |
Respondents were asked to rate their satisfaction with train services to the University. Overall, on a scale of 1 (very poor) to 5 (very good), staff gave an average rating of 3.4 and students rated slightly greater at 3.8. A breakdown of ratings can be viewed in Figure 2-11.
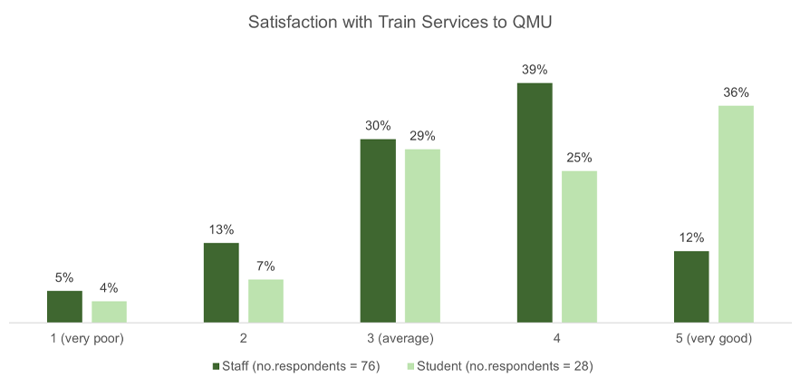
Figure 2.11: Satisfaction with train services to the University
Respondents provided the following comments about trains in the free-response section of the travel survey:
Positive Remarks:
- Having the station next to the University is considered a real advantage, enhancing accessibility.
Negative Remarks:
- Trains are generally expensive, with the cost being prohibitive for regular use.
- Poor connections and limited frequency make train travel less convenient. For example, travelling from Berwick upon Tweed to Edinburgh and back takes nearly two hours each way due to poor connections.
- Limited train timings, particularly in the mornings and evenings, make it difficult for commuters to rely on trains. For instance, there are only two trains arriving before 9 am from Edinburgh to Musselburgh, which is viewed as insufficient.
- Delays and cancellations are frequent issues that lead to frustration among respondents.
Suggestions for Improvement:
- More frequent train services throughout the day are needed.
- Public transport should be more affordable to encourage its use.
- Promotion of discounts such as flexi-pass and railcards.
After a sharp drop in the car mode share for staff in 2023/24, the mode share for this year has increased by 13 percentage points to 44%, as shown in Table 2-7. The student mode share has been fluctuating over the past six years and is 28% for 2024/25 which is a drop of 11 percentage points from the previous year.
Table 2-7: Car mode share
| Year | Staff Mode Share | Student Mode Share |
|---|---|---|
| 2019/20 | 44% | 23% |
| 2020/21 | 46% | 21% |
| 2021/22 | 47% | 38% |
| 2022/23 | 49% | 24% |
| 2023/24 | 31% | 39% |
| 2024/25 | 44% | 28% |
On average people who travel by car as their main mode cover an average of 22 miles in their journey, while the median journey distance is 12 miles. The minimum distance covered is two miles while the maximum is 110 miles.
In total, 68 respondents drive to the University as a primary or secondary mode of travel: 54 staff (including one Blue Badge holder) and 14 students (including two Blue Badge holders). Further details on the fuel type and engine sizes can be viewed in Figure 2-12 and Figure 2-13.
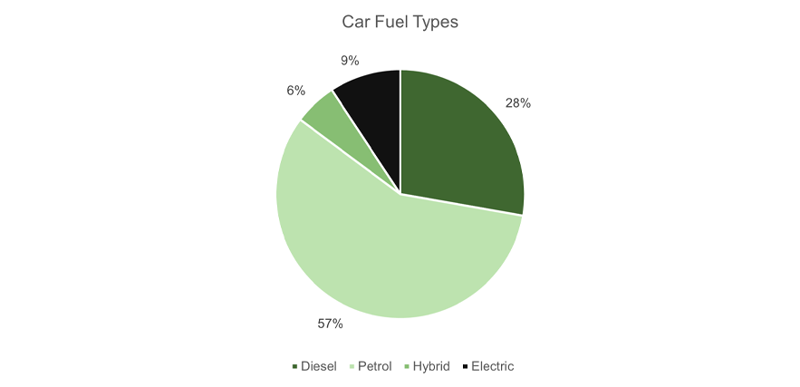
Figure 2.12: Fuel type of car drivers
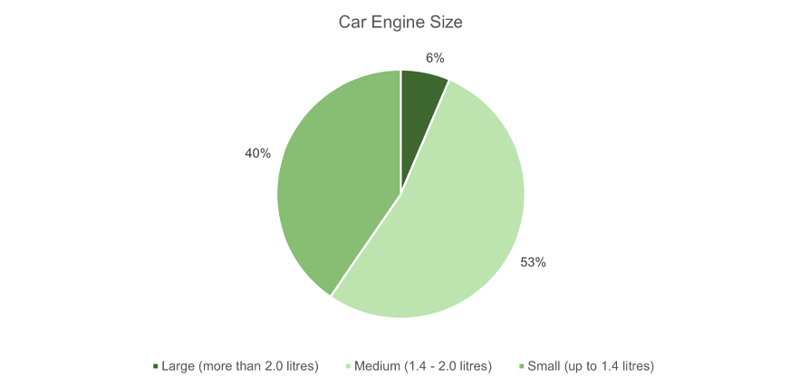
Figure 2.13: Engine size of non-electric car drivers
Currently 15% (8 people) have hybrid or electric vehicles, while petrol is the dominant fuel type followed be diesel. Compared to the previous 2023/24 travel survey, there has been a 7-percentage point drop in the proportion of respondents using electric or hybrid vehicles.
Of those with non-electric vehicles, the majority have medium (1.4 - 2.0 litre) sized engines, with only 6% having large (more than 2.0 litre) engines.
Overall, driving is seen as a quicker and more reliable mode of transport, especially when public transport options are limited or not viable. However, there are concerns about parking availability and costs associated with car travel. Some of the comments left by respondents are as follows:
Positive Remarks:
- Car travel is logistically better for some people, particularly when public transport options are limited or impractical due to poor connections and long travel times.
- Carpooling is noted as a regular practice among some colleagues, which can be beneficial for reducing individual travel costs.
- The cost of car travel can be cheaper compared to public transport for some.
Negative Remarks:
- There are concerns about parking availability, especially during semester time.
- There is frustration about having to pay for parking permits, even for fully electric cars, which are meant to have green credentials.
- More parking spaces are required, especially with the opening of new facilities such as the Innovation Hub.
Suggestions for Improvement:
- Continue to promote car sharing amongst staff and students.
- Undertake a review of permit system/charges, especially with the opening of the Innovation Hub due for later in the year.
- Clearly communicate the reason for any charges/criteria to decrease frustration or confusion.
As was mentioned earlier in this chapter, this year’s survey included a free-type response section at the end. Respondents were asked to provide any other comments or suggestions relating to travel to QMU. Many of the comments left by respondents were in relation to modes of travel, and these comments have mostly been captured in their respective sections earlier in this chapter. The remaining comments will be covered in this section.
Responses in the free-type box included:
- Wanting more information – this included wanting more information on walking and cycling routes. Additionally, wanting more information on carbon calculations;
- Wanting better or more facilities available on campus – respondents asked for more indoor cycle storage, better locker and shower facilities; and
- Expressing general support for the current active travel infrastructure at QMU.
These comments will be taken into account or relayed to the appropriate bodies.
Overall, car use continues to be the most used form of transport to and from QMU. This is followed by train, bus, cycling and then walking/wheeling and running. Compared to 2023/24, in 2024/25 there were upticks in train and car usage, downward trends in bus usage and walking/wheeling and running, and rates for cycling have stayed relatively similar.
To summarise the comments left from respondents regarding walking/wheeling, as well as cycling, these comments focused on things like the condition of roads and paths. For these comments, further collaboration might be something to consider by making local authorities and partners aware of the conditions of the roads or paths that are off campus. Along with the comments regarding locker and storage facilities, comments regarding the promotion of routes and information should be reviewed going forward with both internal and external partners.
For bus and train usage, many of the comments surrounded reliability, efficiency, cost and time. Once again, more collaboration with partners could be considered to raise these concerns with respective partners.
Lastly, overall car usage increased this year in comparison to last year. Respondents who provided comments cite shorter travel times, lower cost and easier commutes as some of the reasons they chose car travel over other modes of transport. Some respondents refer to carpooling which could benefit from further promotion on campus, helping to reduce emissions and travel costs.
As part of the Travel Survey report from 2023/24, points were put forward to help inform the work for 2024/25. Below is a table which contains last year’s points and provides an update of progress.
| Point | Status |
|---|---|
| Review existing provision, and scope to improve, changing, drying and secure bike storage facilities. |
|
| Collaboration with partners to review and improve sustainable transport accessibility, affordability and reliability. |
|
| Collaboration with internal and external partners to deliver and effectively promote sustainable travel initiatives. |
|
| Improved promotion around campus of sustainable transport events and facilities. |
|
3.2.1 Survey Uptake
With a 70.6% increase in respondents this year compared to 2023/24, it is possible that the shorter survey has assisted in a greater response rate. However, 2024/25 results still reflect a small proportion of staff and students. Considerations around how to increase responses should again be considered. A higher response rate would help provide a more accurate picture of the current situation.
Additionally, the student response rate was lower this year compared to staff. Considerations should be given to how to attract more responses from students. A potential targeted approach to capture student feedback should be taken alongside the general advertising campaign when the survey runs again in 2025/26.
Another consideration to increase uptake could be to again shift the travel survey to earlier in the academic year. Although the 2024/25 travel survey took place earlier in the year compared to 2023/24, this could be an adjustment which could potentially lead to more uptake.
3.2.2 Collaboration with Stakeholders
Following on from the comments which were left in the free type box, a number of suggestions and concerns were provided by respondents. Although some issues are outside the direct control of QMU, there are opportunities to continue to collaborate with internal and external stakeholders to try to improve sustainable transport options for students and staff.
Therefore, it is recommended that internal stakeholders, like Facilities Management and Security, are made aware of the suggestions raised. Additionally, Cycle Connections could consider more ways to promote sustainable transport options, as well as active travel routes. Additionally, for external stakeholders like Lothian Bus, Scotrail, East Lothian Council, SESTran and Paths for All, a continuation of collaboration is recommended, as well as raising concerns or suggestions as appropriate for them to investigate.
3.2.3 Points to Progress for 2025/26
Taking into consideration the points and progress from 2023/24, as well as comments from respondents from the 2024/25 travel survey. The following points are being put forward to be progressed and reviewed in the 2025/26 report:
- Explore ways to continue to increase uptake for the next travel survey and implement them. Additionally, create a targeted approach specifically for students to try to increase uptake from students during the next survey;
- Continue to increase and improve promotion to students and staff regarding active travel routes, facilities available around campus and host sustainable transport events;
- Continue collaboration with internal and external stakeholders to raise concerns and suggestions on behalf of staff and students; and
- Continue collaboration with internal and external stakeholders to find ways to promote sustainable transport methods, including exploring rideshare options.


