QMU Transport Emissions - Methodology and Comparison
1 Introduction
In the third iteration of the Scope 3 Transport Emissions: Methodology and Comparison report we will evaluate the emissions associated with travel and transport for the 2021-2022 academic year at Queen Margaret University (QMU). Comparisons will also be made to the previous 3 academic years. The previous 2 academic years were both affected by the Covid-19 Pandemic and the associated restrictions on travel. Further explanation of the effect of this is discussed in the following chapters.
This report has been created to contribute towards the university wide Public Bodies Climate Change Report data as well as highlight the often unaccounted for Scope 3 commuting, relocation and business travel emissions.
The QMU campus is recognised as an exemplar in sustainability within the higher education sector nationally and internationally, it is a physical example of our commitment to sustainability and is the foundation upon which our vision and strategy for sustainability continues to develop. This report is a further contribution to the university’s sustainable credentials.
QMU’s emissions calculations and method was independently checked by the Carbon Team at the Engineering Consultancy firm Sweco in 2021.
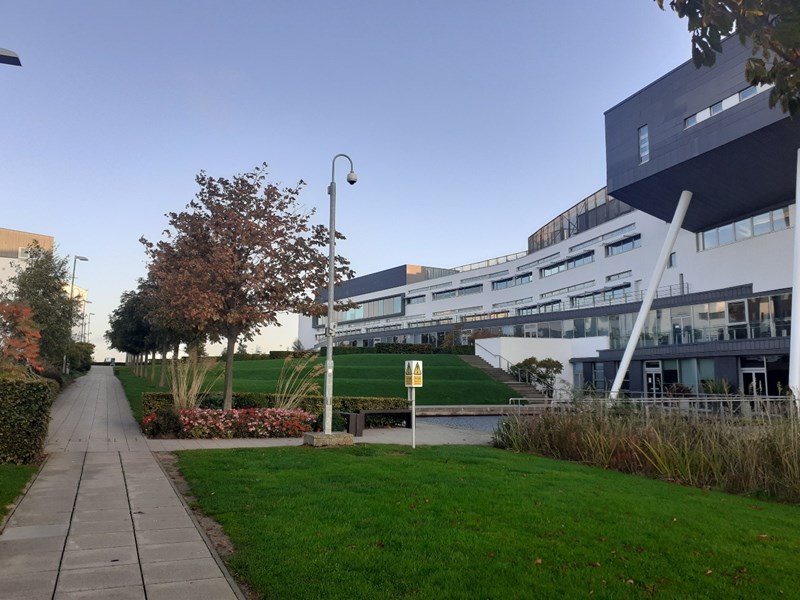
Figure 1.1: QMU campus main building.
2 Scope 3 Transport Emissions
Transport emissions reporting has been divided into 4 categories:
- Daily Commuting (Staff & Students)
- Term Time Relocation (Students)
- Business travel (Staff & Students)
- Student Placement Commuting (Students)
Daily commuting data was sourced through the annual travel survey, term time relocation and business travel data were sourced anonymously from the university’s staff and student records. Plans are still in place to incorporate Student Placement Commuting emissions in the future.
The current magnitude and growth of Scope 3 Emissions within organisations is opaque, it is not yet a required Scope 3 emission in the Public Bodies Climate Change Duties Annual Report. However, understanding the indirect emissions associated with transport is key to creating a reliable baseline that can be used to understand the scale of the problem, plan for the future, and monitor change.
Present emission targets for QMU are a 16% total reduction in carbon emissions from the 2015/16 baseline. However, as we become more inclusive of our emissions in reporting this target may be forced to change.
The university is also aware of the emissions that are associated with the new Working From Home arrangement. Although these are not considered in this report, the author acknowledges that observed reductions in emissions related to business travel and commuting will have a knock-on effect on the rates of ‘Home Emissions’. This is of higher importance this year as households face unprecedented increases in the costs of heating and electricity.
3 Results
The following tables outline the key data relating to Daily Commuting, sourced from the results of the 2019-2020, 2020/2021 and 2021/2022 Annual Travel Survey, and the key data relating to Term Time Relocation, sourced from information on international and Domestic students home domiciles for the same academic years.
Table 3.1 provides an overview of the data sources and their assessed quality. Quality was rated depending on the reliability of the data in terms of any assumptions or upscaling that was required.
| Emissions Activity | Data Quality | Data Source |
|---|---|---|
| Staff Commuting | Medium Quality | Derived from annual travel survey |
| Student Commuting | Medium Quality | Derived from annual travel survey |
| Term Time Relocation | Low Quality | Derived from student home domicile records and uses assumptions for travel frequency and chosen route. |
| Student Placement Travel | Medium Quality | Not yet available |
Table 3.1: Data Overview
Student Placement Travel is included in Table 3.1 and 3.2 to highlight the aspiration to include in this data future years. At present, data is not held on the location and duration of placements, per student.
Table 3.2 shows the emissions relating to general commuting, placement commuting and term time relocation. It shows return to levels closer to pre pandemic emissions for student emissions and term time relocation, however staff commuting emissions has increased by 35% from 2019/20 and 2020/21 levels.
| Emissions Activity |
2018/2019 Emissions (tCO2e) |
2019/2020 Emissions (tCO2e) | 2020/2021 Emissions (tCO2e) | 2021/2022 Emissions (tCO2e) |
|---|---|---|---|---|
| Staff Commuting | 216.8 | 158 | 154.1 | 208 |
| student Commuting | 1310 | 1127 | 576.4 | 1153 |
| Term Time Relocation International | N/A | 985 | 1228.5 | 950 |
| Term Time Relocation Domestic | N/A | 261 | 256.1 | 192 |
| Student Placement Commuting | N/A | Not yet available | Not yet available | Not yet available |
Table 3.2: Emissions per source with adjustments for Covid-19 Pandemic
Figure 3.1 shows a comparison between emissions for 2020/21 and 2021/2022. The left side of the chart shows Daily commuting emissions for 2020/21 and 2021/22. The right side shown the term time relocation emissions for 2020/21 and 2021/22. For the prior year, term time relocation created more emissions, however this year the majority of emissions were from daily commuting. This may be due to the return of most to teaching to in person.
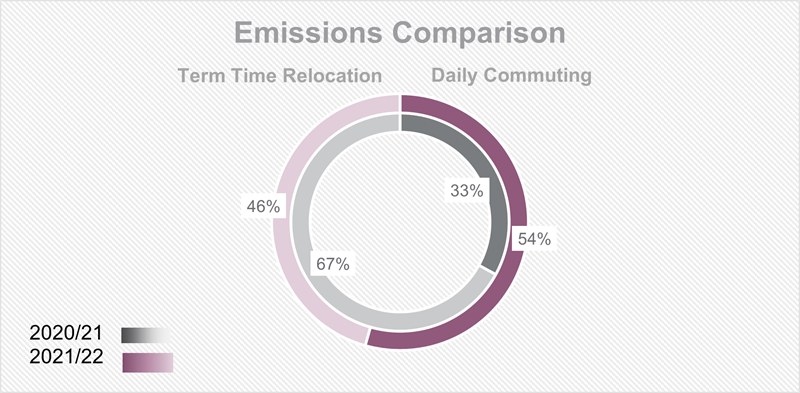
Figure 3.1: Emission source comparison between term time relocation and daily commuting
Tables 3.3 and 3.4 show the breakdown of emissions for both academic years. In both tables it can be observed that emissions relating to staff are lower overall but higher when calculated per person. This is expected to be due to the likelihood of staff living further from campus, having increased likelihood of caring responsibilities and having increased access to a private vehicle (assumptions based on annual travel survey data).
| 2019/2020 Emissions Category | kgCO2e | tCO2e |
|---|---|---|
| Total Commuting Emissions | 1285603 | 1286 |
| Total Student Emissions | 1127171 | 1127 |
| Total Staff Emissions | 158431 | 159 |
| Average Emissions Per year per Student | 264 | 0.26 |
| Average Emissions Per year per Staff | 340 | 0.34 |
Table 3.3: 2019-20 Emissions Per Source
| 2020/2021 Emissions Category | kgCO2e | tCO2e |
|---|---|---|
| Total Commuting Emissions | 730475 | 731 |
| Total Student Emissions | 576352 | 576576 |
| Total Staff Emissions | 154123 | 154 |
| Average Emissions Per year per Student | 141 | 0.14 |
| Average Emissions Per year per Staff | 331 | 0.33 |
Table 3.4: 2020-21 Emissions Per Source
| 2021/2022 Emissions Category | kgCO2e | tCO2e |
|---|---|---|
| Total Commuting Emissions | 1362176 | 1362 |
| Total Student Emissions | 1154923 | 1154 |
| Total Staff Emissions | 207253 | 207 |
| Average Emissions Per year per Student | 217.14 | 0.27 |
| Average Emissions Per year per Staff | 446.67 | 0.45 |
Table 3.5: 2021-22 Emissions Per Source
The following tables show the number of journeys recorded per week, the percentage of journeys per mode of travel and a total journeys per week according to those that took part in the survey, and then scaled up to represent the whole university community. The numbers are scaled by increasing the rates by the ratio of:
- The number of staff survey respondents: The number of campus-based staff
- The number of student survey respondents: The number of campus-based students
The past 3 academic years have been included to provide comparison.
| Year | Split | Car | Public | Active |
|---|---|---|---|---|
| 2018-2019 | Primary | 329 | 580 | 261 |
| 2018-2019 | Secondary | 84 | 225 | 60 |
| 2018-2019 | Total | 28% | 55% | 17% |
| Year | Total Journeys Per Week | Scaled to whole university |
|---|---|---|
| 2018-2019 | 1843 | 23546 |
Table 3.6: 2018/2019 Weekly journey count and percentage share
| Year | Split | Car | Public | Active |
|---|---|---|---|---|
| 2019-2020 | Primary | 296 | 488 | 213 |
| 2019-2020 | Secondary | 92 | 169 | 71 |
| 2019-2020 | Total | 29% | 49% | 21% |
| Year | Total Journeys Per Week | Scaled to whole university |
|---|---|---|
| 2019-2020 | 1329 | 17150 |
Table 3.7: 2019/2020 Weekly journey count and percentage share
| Year | Split | Car | Public | Active |
|---|---|---|---|---|
| 2020-2021 | Primary | 78 | 73 | 64 |
| 2020-2021 | Secondary | 26 | 24 | 16 |
| 2020-2021 | Total | 37% | 34% |
28% |
| Year | Total Journeys Per Week | Scaled to whole university |
|---|---|---|
| 2020-2021 | 270 | 5839 |
Table 3.8: 2020/2021 Weekly journey count and percentage share
| Year | Split | Car | Public | Active |
|---|---|---|---|---|
| 2021-2022 | Primary | 172 | 150 | 81 |
| 2021-2022 | Secondary | 6 | 17 | 22 |
| 2021-2022 | Total | 40% | 37% |
23% |
| Year | Total Journeys Per Week | Scaled to whole university |
|---|---|---|
| 2021-2022 | 449 | 8183 |
Table 3.9: 2021/2022 Weekly journey count and percentage share
It can be observed from Tables 3.5-3.8 that the reducing of restrictions related to the Covid-19 pandemic has increased the number of journeys to campus, as in person working and teaching becomes more frequent. Table 3.5 represents travel habits prior to the pandemic. Comparing it to present day shows a marked decrease in public transport use. When asked in the 2021/2022 travel survey, this was due to lack of convenience frequency and reliability.
There is has been a 6% increase in rates of active travel over the past 4 years, however a significant decline between last year and this year. The pandemic saw nationwide increase in rates of walking and cycling.
Car use has been increasing for the past 4 years, when asked why respondents travelled by car the most common response was ‘Journey Time’. In contrast, when asked what would encourage them to travel by public transport or active travel the response was ‘Nothing, it is impractical’ followed by ‘Traffic Free Cycle Routes’ or ‘Better Weather’ respectively.
4 Daily Commuting
4.1 Commuting Habits
Figure 4.1 compares the transport modal share for the 2021/22 academic year and the national average. It shows higher rates of sustainable modes of travel compared to the 2020 national average reported by Transport for Scotland
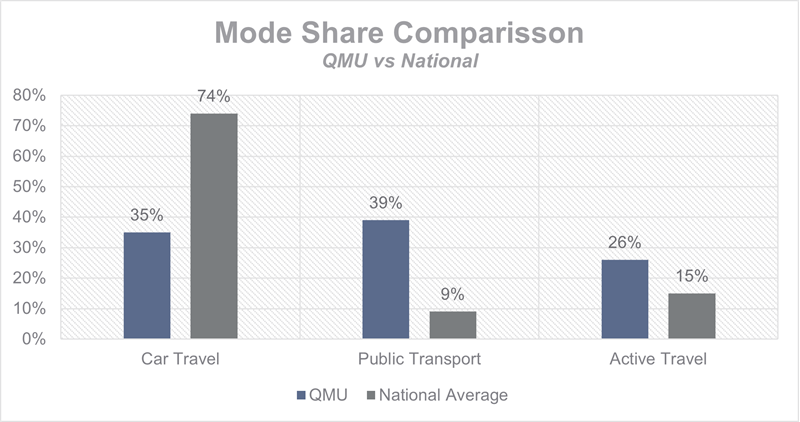
Figure 4.1: QMU and National Transport Mode Share
Figure 4.2 compares the QMU primary mode share between 2018 and 2022.
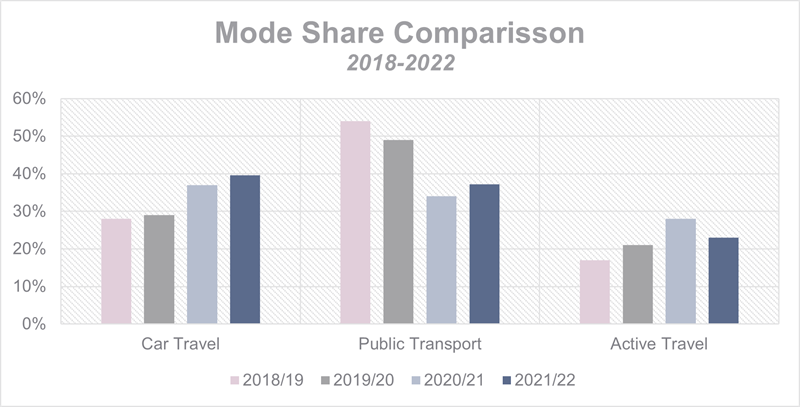
Figure 4.2: QMU Transport Mode Share
Figure 4.3 shows the trends in the number of bikes counted on campus. Counts were carried out for both bike sheds and the main bike racks in front of the university building. The grey shaded area of the graph represents the university’s closure during the Covid-19 pandemic
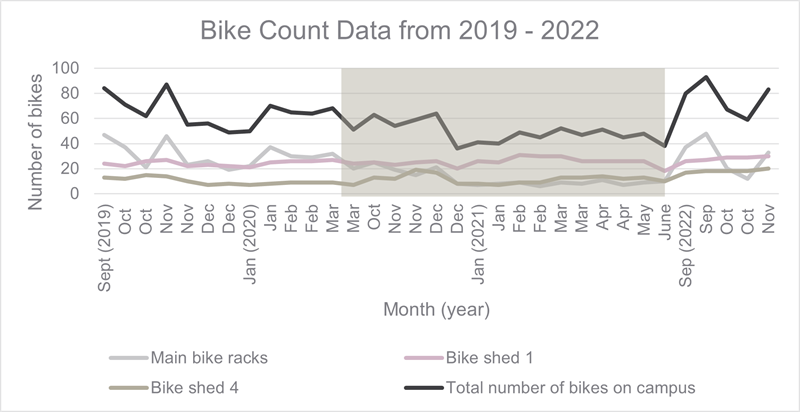
Figure 4.3: Bike Count data
Bike counts are carried out twice monthly by the active travel team. Counts are conducted at the same time of day, and notes of weather conditions (e.g. rainy), or time of year (e.g. winter holidays) are made.
There are three main trends seen in the graph:
1) The total number of bikes decreases during the period of closure due to the Covid-19 pandemic. This is likely due to the decrease in the number of bikes at the main bike racks.
2) The number of bikes in both bike sheds remains consistent over time
3) Following the return to teaching after the Covid-19 closure, there is an increase of bikes on campus
These results can be expected as students and staff were not present in usual numbers during the Covid-19 pandemic therefore trend 1 reflects the fact that fewer individuals were commuting to campus regularly. Since trend 2 shows that the number of bikes in the bike sheds remains consistent, more work can be done to engage the campus residents in cycling. Finally, after the Covid-19 campus closure, there have been high numbers of bikes on campus. This may reflect the behaviour change seen during the pandemic, where many experienced the benefits of active travel alongside avoiding public transport.
One caveat to these results is that there are over 20 abandoned bikes residing in the two bike sheds on campus. This highlights that the bike counts are an indirect measure of cycling rates, in particular, the bike shed counts. It can be expected that a bike locked at the main bike racks would be removed and used on the same day, however a bike locked in the bike sheds can be locked there for a long period of time with no use.
4.1.1 Staff Commuting results:
In the 2021/22 academic year staff commuting related to 207 tCO2e, this is a 34% increase on the previous year. Despite the campus being fully open for both years, in-person teaching was reduced in the 2020/21 academic year and the option to work from home remained in place for the majority of staff. Therefore, it can be assumed that staff and students were commuting more often than they were the previous year. According to the travel survey, 55% of staff worked from home 2 or more days a week this year, compared to 85% in the last academic year.
86% of staff surveyed arrived on campus after 8am, 28% after 9am, while departure times were most commonly before 5pm, 68%.
4.1.2 Student Commuting Results:
Between the 2020/21 and 2021/22 academic year there was an estimated 50% increase in the commuting emissions from student commuting, however it is only a 2% increase eon the 2019/20 levels.
These drastic changes over the last 3 years are due to temporary changes in teaching and working practices and emissions were expected to increase again once lockdown restrictions were lifted and work/study habits returned to a more ‘on-campus’ arrangement
4.2 Change in Reporting
Commuting emissions are calculated using data from our annual travel survey, conducted at the start of semester 2. The response rate for the 2018/2019 and 2019/20 year was 13%, the 2020/21 Travel survey response rate was 5% and 2022 was 6%. This reduced completion rate means the results are less reflective of the whole community. The drop-in response rate is expected to be due to the reduction in people on campus and so less people to reach face-to-face. The heightened stress/overload may also have contributed to people being less likely to participate.
Several changes were made to the data collection process in the 2019/20 year in order to reduce assumptions and increase reliability, these changes were carried on in the 2020/21 and 2021/22 years. The example emissions calculator is shown in Appendix A and was proofed by the Carbon team at consultancy firm Sweco.
In order to improve accuracy around distance travelled by each mode the question from the 2019/20 survey was changed to ask for ‘one-way’ distance travelled and specified that the answer should be in miles. The answer box was also restricted to only allow numerical answers
Additional questions around the consequences of the Covid Pandemic were added to the Annual Travel survey for 2020/21 & 2021/22, these were:
- Specify the days you work/study on and off campus?
- What was your mode of Travel prior to March 2020?
‘Covid concerns’ was also added as an answer option when asked why a participant chose/did not choose a mode of travel.
4.3 Future Improvements
To reduce emissions relating to daily commuting we will:
- Create a format for monitoring placement commuting
- Increase offering of cycle training
- Increase number of cycles available for hire to staff and students
- Look into re-starting a Liftshare scheme
The following are the recommendations from the 2021/22 report that have been successfully actioned:
- Continue to promote our active travel initiative - Cycle Connections. Using it to share information on facilities, route, and active travel events;
- Continue to engage the staff and student body with events, including regular free Dr Bike sessions;
- Bike to Work Scheme adjusted max spend – Increased from £1000 to £3000
Emissions Reduction Plan: QMU Active Travel Strategy
5 Term Time Relocation
5.1 Term Time Relocation Change
There is an observed 23% decrease in term time relocation emissions from the 2020/21 academic year, and a 4% decrease on pre-pandemic rates. The average distance travelled in 2021/22 academic year was 4957km (one way). Total emissions for international and domestic students relocation is shown in Table 5.1.
| CO2 | Total International Emissions | Total Domestic Emissions |
|---|---|---|
| Tonnes CO2e | 951 kg CO2e | 193 kg CO2e |
Table 5.1: Term time relocation emissions
Figure 5.1 shows the number of students travelling to QMU per country for the 2021/22 academic year.
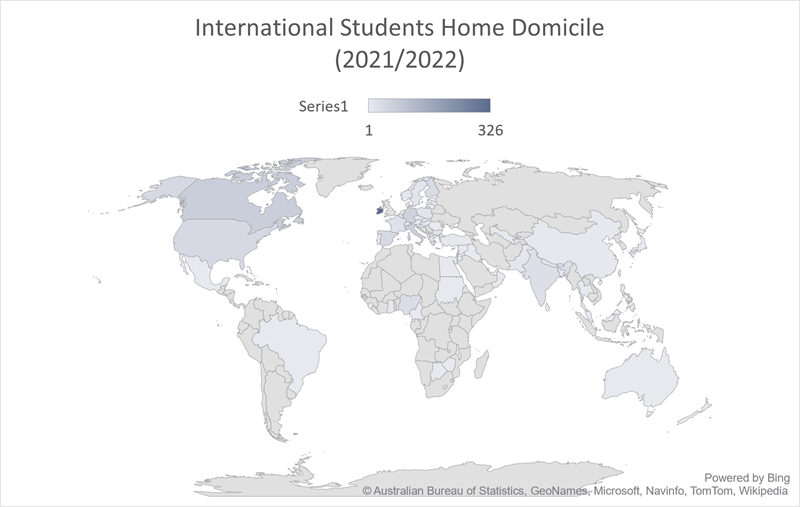
Figure 5.1: Students Home Domicile 2020/2021
Data was obtained from QMU Student Recorded department. It was made anonymous and stated the home domicile of each student at the time of them joining the university. From this it was assumed that each student flew from the capital city of the stated country and flew directly, economy class, to Edinburgh Airport. Where there was no capital city airport, the nearest airport was selected.
Distance travelled was calculated using a flight distance uplift factor which accounts for elevation change and curvature of the Earth and is used to account for delays or circling. This information was combined in a spreadsheet and the final carbon emissions were calculated using the government provided emission conversion factors for International (medium haul), European (short haul) and Domestic (domestic) flights.
Journeys were categorised as International non-European, International European and Domestic (England, Ireland, Wales). It was assumed that those living closer to campus would return home more often. Domestic students would make three round trips per academic year, European internationals would make two and non-European internationals would make one round trip.
It was assumed that Domestic students would travel to campus via an equal mix of car/ferry, aeroplane, train and coach. For those from Isle of Man, Jersey and Guernsey it was assumed 100% of journeys would be by aeroplane.
The method of reporting stayed the same to the previous 2019/2020 method.
5.3 Recommendations for Future Accuracy
To improve the accuracy of our term time relocation emissions we will:
- Work with the universities admissions team to obtain information on class of flight, directness of route
- Run a survey for students to determine how often they return home during the academic year.
Emissions reduction plan: Remote Study Options
6 Staff Business Travel
6.1 Land Travel
Tables 6.1 and 6.2 summarise the emissions and spend associated with business land travel.
| Emissions Activity | 2019/2020 KM travelled | 2019/2020 equivalent tCO2e | 2020/2021 Km travelled | 2020/2021 equivalent tCO2e | 2021/2022 Km travelled | 2021/2022 equivalent tCO2e* |
|---|---|---|---|---|---|---|
| Car | 23,323 | 6.4 | 3,386 | 0.93 | 10,824 | 2.99 |
Table 6.1: Business Car Travel
*Using emission conversion for Average Car/Unknown Fuel from 2022 Government Conversion Factor
| Emissions Activity | 2019/2020 £ spent | 2020/2021 £ Spent |
2021/2022 £ Spent |
|---|---|---|---|
| Taxi | £8000 | £2,004 | £1534 |
| Rail | £2854 | £499.90 | 10,810 |
Table 6.2: Business Rail and Taxi Travel
The 2021/22 business car journeys account for 2.99tCO2e compared to 0.93tCO2e for the 2020/21 academic year. Although a 221% increase, it is a 114% decrease on the 2019/20 academic year.
Business Taxi journeys are managed by Central Taxis. They recorded a continued decrease in Total Job Distance Miles for a second year, Table 6.3.
| Taxi Journeys (Sept 2019-Aug 2020) | Value |
|---|---|
|
Average Job Distance (Miles): |
6.02 |
|
Total Job Distance (Miles): |
3310.10 |
|
Total Job CO2 Emissions (tCO2e): |
0.93 |
|
Average Dead Distance (Miles): |
1.31 |
|
Total Dead Distance (Miles): |
715.70 |
| Total Dead CO2 Emissions (tCO2e): | 0.20 |
|
Taxi Journeys (Sept 2020-Aug 2021) |
Value |
|---|---|
|
Average Job Distance (Miles): |
3.6 |
|
Total Job Distance (Miles): |
642.8 |
|
Total Job CO2 Emissions (tCO2e): |
0.162 |
|
Average Dead Distance (Miles): |
1.04 |
|
Total Dead Distance (Miles): |
169 |
| Total Dead CO2 Emissions (tCO2e): | 0.044 |
|
Taxi Journeys (Sept 2020-Aug 2021) |
Value |
|---|---|
|
Average Job Distance (Miles): |
5.6 |
|
Total Job Distance (Miles): |
5.03.60 |
|
Total Job CO2 Emissions (tCO2e): |
0.128 |
|
Average Dead Distance (Miles): |
1.87 |
|
Total Dead Distance (Miles): |
167.4 |
| Total Dead CO2 Emissions (tCO2e): | 0.043 |
Table 6.3: Yearly comparison in business travel Taxi Emissions.
Central Taxis carbon offset all of Queen Margaret Universities pre-booked and contract taxi hires, as certified by Carbon Footprint Ltd. Dead miles (miles covered to reach start point of hire) are not offset. This resulted in 0.043 tCO2 emissions that were not offset in the 2021/22 academic year.
Central Taxis currently have 32 LEVC commercial electric vehicles in their fleet, an increase of 12 from the previous year. Their lower emissions rate is used when they log a journey. All other taxis in the Central Taxis fleet are Euro 5 emissions level, in line with Edinburgh Council Legislation.
6.1.2 Reporting
Business Car journey data for this academic year is sourced from Arnold Clark, the registered car hire provider for the university. Previous years the data was sourced from Key Travel Expenses.
Business taxi journeys are encouraged to be booked through Central Taxis. Central Taxis keep a log of job and dead miles associated with all QMU bookings and provide an annual report. However, they are anticipated to be underreported as staff may choose to book independently for convenience or due to lack of awareness.
Rail travel expenses are a combination of those logged officially through Key Travel, the recommended method, as well as credit card and expenses claims with a specified use of ‘Rail travel’.
6.2 Recommendations for Future Accuracy
To ensure future improvements in accuracy, we will:
- Work with the finance office and staff services to increase reliability of reporting;
- Promote the use of Central Taxis and Arnold Clark Car Hire; and
- We will monitor the introduction of Electric Rail Lines so as to reflect this in reporting.
Emissions Reduction Plan: Green Travel Plan
6.3 Air Travel 6.3.1 Results
| Emissions Activity | 2019/2020 Km Travelled | 2019/2020 CO2 Emissions (tonnes) | 2020/2021 Km Travelled | 2020/2021 CO2 Emissions (tonnes) | 2021/22 Km Travelled | 2021/22 CO2 Emissions (tonnes) |
|---|---|---|---|---|---|---|
| Air Travel | 373,160 | 57 | 61,660 | 9.2 | 106,452 | 11.7 |
Table 6.4: Business Air Travel cost emissions and distance.
All recorded flights were economy/premium economy, this reduces the carbon emissions as less space and services are associated with each individual.
6.3.2 Reporting
Data is sourced from the finance department, whereby staff record the travel via finance codes. However, as travel is booked by individuals there are inaccuracies due to human error. There are issues of travel being claimed on expenses or credit card, which is then difficult to track and analyse or the expense not being recorded as travel related.
Although air travel has increased since lockdown restrictions have eased, it is hoped and planned that an increase in digital communications and remote webinars to ask staff and students to consider whether there is a need to fly.
6.4 Recommendations for Future Accuracy
In order to increase accuracy and ensure that we are capturing all journeys we will:
- Work to increase promotion and education around the expenses tool.
- Promote the use of digital meetings to avoid business travel
- We will continue to encourage staff to choose economy class when flying is necessary
Emissions Reduction Plan: Green Travel Plan
6.5 business Accommodation Associated Emissions
6.5.1 Results
£2355 was spent through the Key Travel account for businesses accommodation during the 2021/22 academic year compared to £956.52 in the 2020/2021 academic year. A further £21,618 was spend on credit cards and through expenses for business accommodation in the 2021/22 academic year.
6.5.2 Reporting
Staff are responsible for reporting business accommodation using the appropriate finance codes and booking through the university affiliated company, Key Travel. At present cost of stay is the sole method of recording and hotel room cost and subsistence are combined. As demonstrated above, the majority of charges are not put through this system and instead are on credit cards and expenses.
6.6 Recommendations for Future Accuracy
We will work with HR to ensure all staff are aware of the correct booking protocol to ensure all emissions are recorded
Emissions Reduction Plan: Green Travel Plan
7 Summary and Conclusions
7.1 Summary
The university is proud to take accountability for it’s Scope 3 emissions and sees the importance in reporting indirect emissions associated with commuting, an often-ignored source for institutes.
Although commuting related emissions have increased from the previous years level, they are still below pre-pandemic levels despite the reinstatement of on campus working and teaching. Staff commuting emission are 4% below pre-pandemic levels and student commuting is 12% below pre-pandemic levels.
In order to maintain and improve upon these reductions and meet Scottish Government targets of Net Zero by 2030 the university will have to continue its work desensitising single occupancy, unsustainable travel and promote active travel and public transport. The university will be required to expand it’s promoting, past commuting to include business travel and term time relocation and travel to student placements.
The transport team will work with the university reporting systems to increase usage and reliability of services such as Key Travel and Central Taxis, as well as working with placement management team to create a usable source of placement commuting data.
The university remains proud of its sustainable credentials and its constant strive to improve.
7.2 Conclusions
The data included in this report allows us to make the following conclusions:
- Rates of business travel have increased following the removal of Covid-91 restrictions
- Levels of car travel are up on pandemic levels, while public transport usage is down.
- Business travel emissions have increased on pandemic levels but are still below pre-pandemic levels.
- Term time relocation emissions have decreased by 23%, however there was also a 28% reduction in student numbers recorded.
- Rates of walking and wheeling to campus by staff and students has decreased on last years record high, however it is still above pre-pandemic levels.
- The university has secured funding for a Campus Cycling Officer for a 5th year and will continue to promote sustainable travel through its Cycle Connections programme.
[image]