QMU Active Travel Survey Report 2021-2022
1.0 Introduction
1.1 Background
Queen Margaret University (QMU) has been undertaking annual travel surveys since 2008, with the results published annually on the university website. The Travel survey is used to monitor travel and transport related emissions, changing travel habits, gather feedback on facilities and to promote facilities on campus which support more sustainable forms of transport. The data from the travel survey is used to inform future targets and allocation of resources as well as to calculate Scope 3 emissions for inclusion in wider carbon emissions and sustainability reporting.
Sweco were commissioned by QMU to undertake the 2021-22 travel survey and generate this report, between March-May 2022. The results have been compared to the previous year’s surveys and trends analysed where this has been appropriate.
The Annual Travel survey was again affected by the ongoing impacts of the Covid-19 pandemic. At the time of the survey (March-April 2022) remote working and online learning were still in place for certain staff and students depending on their role and course. Unlike the previous year however, the service 45 Lothian bus was operational, and the car park permit system was reinstated.
1.2 Report Structure
The content of this report is structured as follows
- Chapter 2 – Analysis of the Travel Survey questions and methodology;
- Chapter 3 – Summary of the results from the 2021/22 Travel Survey;
- Chapter 4 – Scope 3 Commuting Emissions
- Chapter 4 – Progress made; and
- Chapter 5 – Summary of the report.
2.0 Analysis
2.1 Survey Content
Guidance was taken from previous travel surveys undertaken by Sweco for QMU in developing the 2021/22 survey, however due to the ongoing Covid-19 pandemic, adapted questions introduced last year were retained for this year’s survey. As a result of a return to campus by most staff and students, in person and print promotion of the survey was able to be used, as well as via social media and the moderator email.
The Survey ran for 6 weeks from 21st Feb to 4th April. The response rate was again lower than pre-pandemic years at 269 responses. This has been attributed to the reduction in on-campus teaching and working and ‘Survey Fatigue’ due to the prevalence of campus surveys over the academic year.
The survey was set up such that respondents answered general and demographic questions, they were then able to answer questions relevant to their chosen mode of travel. Finally, participants had the opportunity to make any further comments and supply a staff or student email address to be included in a cycling monthly mailer or for entry into a prize draw to win £50 vouchers, which acted as an incentive to increase the number of survey responses. The relevant section topics are listed below:
- General information and mode choice;
- Effects of Covid-19;
- Walking facilities;
- Cycling facilities;
- Local Bus Services;
- Local Train Services;
- The use of private vehicles;
- Other travel;
- Working from Home;
- Active Travel Promotion;
- Closing remarks.
3. 2021 - 2022 Travel Survey Results
3.1 General Results
The survey was open to staff and students with the response ratio being roughly 2:1 student to staff, similar to previous years ratio. Despite the ratio of actual students to staff being 10:1 it is assumed staff are more likely to read the moderator and participate in workplace surveys. The role share is shown in Figure 3.1.
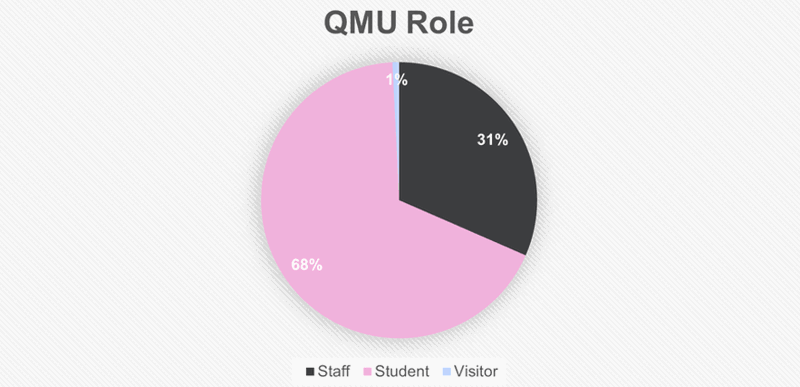
Figure 3.1 QMU Role
Table 3.1 shows the percentage mode share of all journeys and the number of journeys made per week. Results are shown based on surveys responses and then scaled to the whole university population. Both Public and Active Travel rates decreased from the 2021 results while car usage remained similar. Of those that used the bus prior to the pandemic, 76% continued to do so while 12% chose to walk instead. Of those that used the train prior to the pandemic, 90% continued while 10% chose to drive instead. This switch away from public transport is reflective of concerns around transmission safety that were raised by participants and reported in national media. The likelihood of bus travel representing more local journeys while train journeys are generally further can explain the increased prevalence of those travelling by bus prior to the pandemic switch to walking.
| Year | %Car | %Public Transport | %Active Travel |
|---|---|---|---|
| 2022 | 35% | 39% | 26% |
| 2021 | 34% | 42% | 34% |
| 2020 | 27% | 54% | 17% |
| 2019 | 28% | 54% | 17% |
| Year | Total Journeys | Scaled to University |
|---|---|---|
| 2022 | 540 | 11678 |
| 2021 | 284 | 6142 |
| 2022 | 1661 | 21430 |
| 2019 | 1843 | 23546 |
Table 3.1: Mode share & Trip Count
Compared to Scottish commuting rates, reported by Transport Scotland, QMU has lower rates of car travel and higher rates of active travel and public transport commuting.
Figure 3.2 shows a comparison between the QMU commuting mode share and the commuting mode share reported by Transport Scotland for 2020.
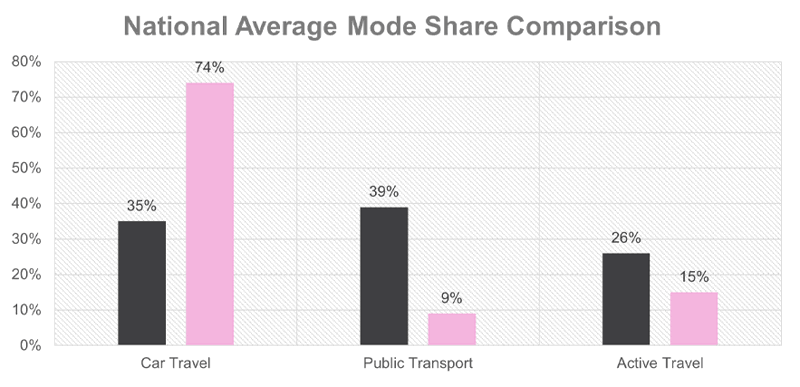
3.2: Mode share comparison between QMU and national average.
3.2 Arrival/Departure Times
Participants were asked to specify the usual arrival and departure times, the results are shown in Figure 3.3 and 3.4.
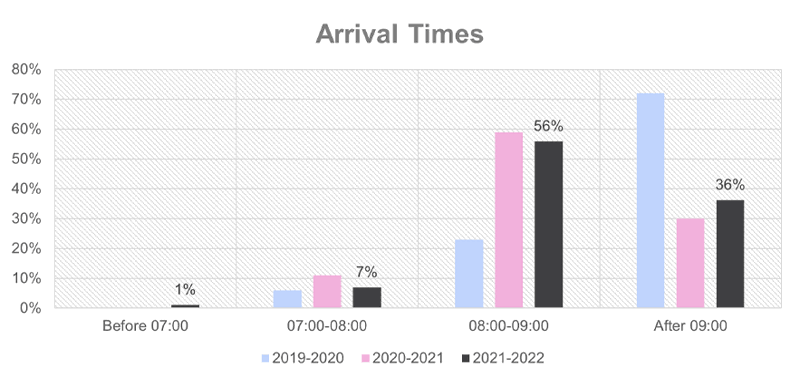
Figure 3.3: Arrival Times
Figure 3.4: Departure Times
When comparing the results to previous years, it can be seen that that arrival times since the Covid-19 pandemic have become smoother, with a more even spread throughout the day, with the majority, 56%, arriving between 08:00-9:00am. This is assumed to be partly due to the extended teaching day which was introduced due to the Covid-19 pandemic with the aim of reducing the number of people on campus at once. It may also be due to the prevalence of online teaching allowing students to attend campus on a more flexible basis.
As with arrivals, since the Covid-19 pandemic departure times are more evenly spread, with people departing throughout the afternoon/evening.
3.3 Commuting Distance
Participants were asked to state their usually one-way commuting distance in miles. The results are shown in Table 3.2. 20% had a commute of less than 5 miles, 3% more than the previous year. These participants are excellent candidates for active travel. Only 2% of participants drove less than 5miles and 5% used the train or bus for journeys of less than 5miles.
| Analysis | Result |
|---|---|
| Maximum | 142 |
| Maximum | 0.5 |
| Mode | 6 |
| Mean | 19 |
| Standard Deviation | 22 |
Table 3.2: Commuting Distance Averages
3.4 In-person Vs Remote Working
To determine the affect the Covid-19 pandemic, and associated changes to working habits, a new question was introduced asking what days the participant worked or studied on campus, off campus or had a day off. The results are shown in Figure 3.5.
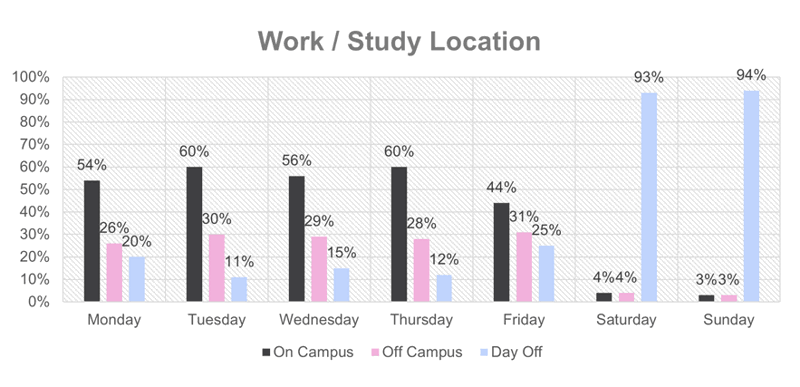
Figure 3.5: Work / Study Location
The results show the busiest days on campus as Tuesday and Thursday, this is supported by the Timetabling offices findings that Tuesday and Thursday are the busiest days for on-campus teaching. Friday has the highest rates of Working from Home and Saturday and Sunday represent the majority of staff and students’ days off.
3.5 Mode Share
Students and staff members were asked both their primary and secondary modes of transport used to commute to and from Queen Margaret University.
The Primary mode share showed that only 2% of people were working solely from home, this is a tenth of the level observed in the previous year. For comparison purposes these have been excluded from analysis.
Car travel became the most common mode of travel at QMU, at 41%. This represents a 6% increase in the previous year and an overall upward trend over the previous years. Active Travel rates reduced to pre pandemic levels (21%) while public transport mode share increased to 38%, this is a 2% increase on last year but an overall 12% drop on pre pandemic levels.
34% of participants included a secondary mode of travel. Walking was the most common form of secondary mode of travel, this is presumed to be related to those walking to the bus or train station as part of their commute.
Figure 3.6 displays the overall mode share, combining Primary and Secondary.
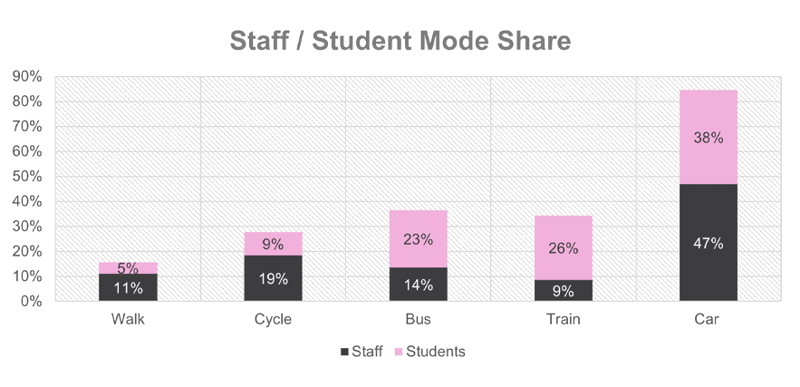
Figure 3.6: Staff / Student Mode Share
The overall results again show a reluctance to use Public Transport since the pandemic and show a decline in Active Travel rates, this was expected after the sudden boom in rates of walking and cycling over the peak of the pandemic.
3.6 Covid-19 Effect
As previously mentioned, the survey has been altered since pre-pandemic times to take into account the changing commuting habits and concerns around safety. To gauge the effect of Covid-19 on commuting at QMU all participants were asked to specify whether their mode of travel had changed.
Results found that the majority did not change their mode of travel, once commuting restarted. Full results are shown in Table 3.3.
| Pre-Pandemic Mode | Remained the Same | Switched to Active Travel | Switched to Public Transport | Switched to Private Vehicle |
|---|---|---|---|---|
| Walk | 67% | N/A | 16% | 17% |
| Cycle | 86% | N/A | 0% | 14% |
| Bus | 76% | 18% | N/A | 0% |
| Train | 90% | 0% | N/A | 10% |
| Car | 93% | 0% | 7% | N/A |
Table 3.3: Covid-19 Effect on Commuting Mode
It is worth noting that not all change to mode of travel will be as a response to Covid-19, however it can provide an indication of thought behind mode choice. 18% of bus users switching to Active Travel is reflective to what was reported nationally, and echoes noted concerns over Covid-19 concerns specifically on buses.
The switch by 10% of train users to private vehicles versus 0% of bus users making the same switch also matches national findings that those that commute by train are more likely to also own a vehicle.
4. Walking Results
The following section outlines the findings from those who commuted by foot as their primary or secondary mode of travel.
4.1 Distance
All participants who walked all or part of their commute were asked to select which distance they most often travelled by foot:
- Less than half a mile
- Less than 1 mile
- Less than 2 miles
- More than 2 miles
The majority, 53%, walked between 1-2miles one way, while no-one walked less than half a mile. This is a change from previous years when those living on campus were included in results and so increased the proportion of those walking a short distance.
4.2 Reason
When asked what a participant’s reasons were for choosing to walk, the top three reasons where:
- Cost (70%)
- Health Benefits (59%)
- Enjoyment (46%)
The option to specify an ‘other’ option was given, with reasons being the inability to drive, proximity to QMU and convenience.
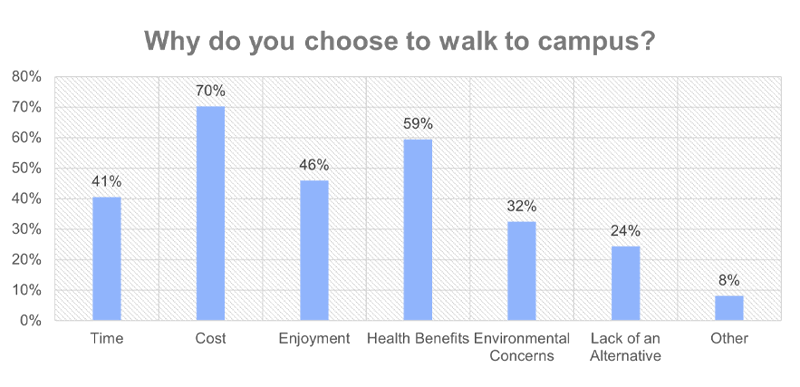
Figure 4.1: Motivation to Walk
4.3 Safety
Of those that walked to QMU, 73% stated that they felt safe walking to campus, the remaining stated that they sometimes felt safe.
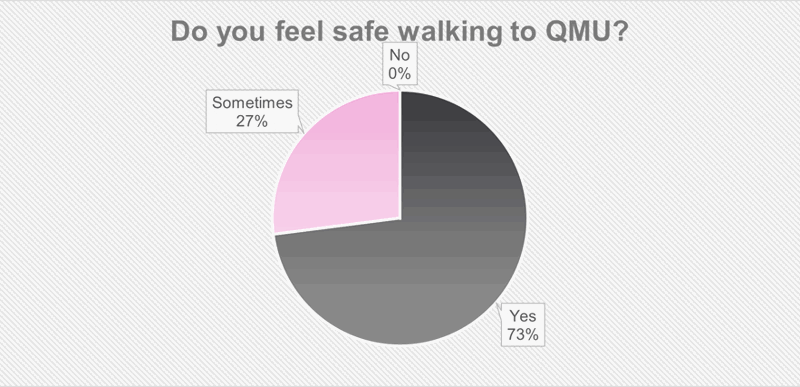
Figure 4.2: Walking Safety
The following question asked whether their route had adequate lighting and crossings, 22% stated they did not. In particular the quality of lighting along Newhailes Rd and the NCN 1 between campus and New Craighall was raised.
4.4 Walking Summary
In summary, a walking commute was often chosen due to the minimal cost and the perceived health benefits. The majority of participants walked less than 2miles each way, compared to the university average across all modes of 18.6miles.
In terms of safety, 27% only felt safe some of the time, and when asked about adequate lighting and crossings, 22% felt more was needed.
Of those that didn’t walk as part of their commute, distance, weather and quality of routes was often cited as a deterrent. Specific mention was made to the footpath between Newcraighall Train Station and campus being a deterrent due to safety concerns. Lastly, a suggestion was made to surface the link between the south entrance of the university and the new shared use path to improve links to the new houses.
5. Cycling
The following section outlines the findings from those who commuted by cycle as their primary or secondary mode of travel.
5.1 Distance
All participants who cycled all or part of their commute were asked to select which distance they most often travelled by cycle:
- Less than 1 mile
- Less than 3 miles
- Less than 6 miles
- More than 6 miles
Only one participant cycled less than a mile, while there was a relatively even split between those the remaining 3 distances.
5.2 Reason
When asked what the reasons for a participant choosing to cycle, the 3 most popular were:
- Health Benefits (97%)
- Environmental Concerns (79%
- Enjoyment (70%)
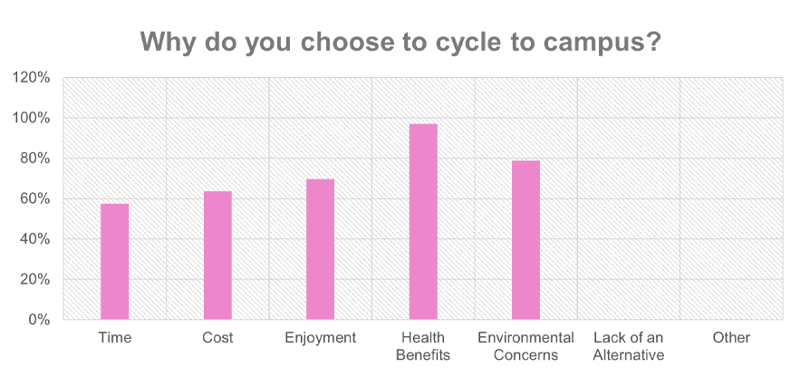
Figure 5.1: Cycling Motivation
5.3 Safety
Of those that cycle to QMU, 64% stated that they felt safe cycling to campus, the remaining stated that they sometimes felt safe. Figure 5.2 shows these results.
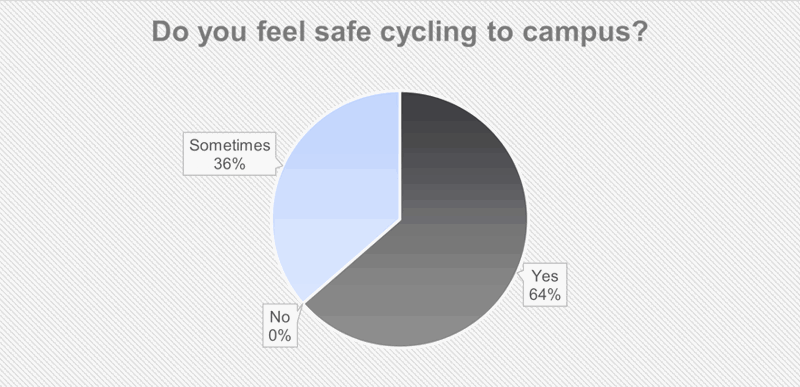
Figure 5.2: Cycling Safety
Participants were then asked whether they used a designated cycle lane or track to reach campus. The results are shown in Figure 5.3
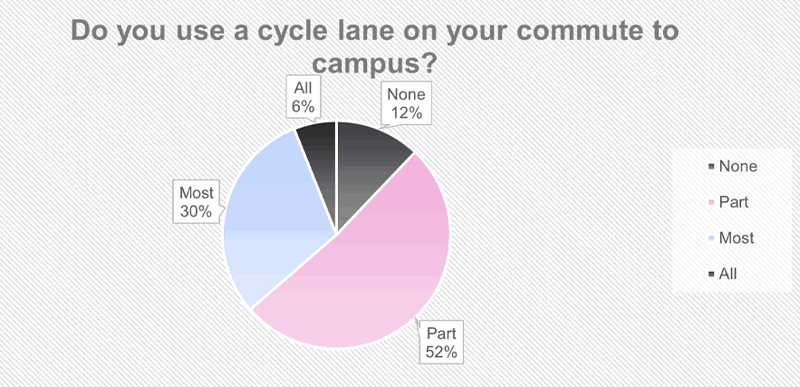
Figure 5.3: Cycle Lane Usage
5.4 Campus Facilities
Participants who cycled to campus were asked to rate the campus cycling facilities from 1 - 5 stars. The most common rating was 4stars. No one rated the facilities less than 3stars.
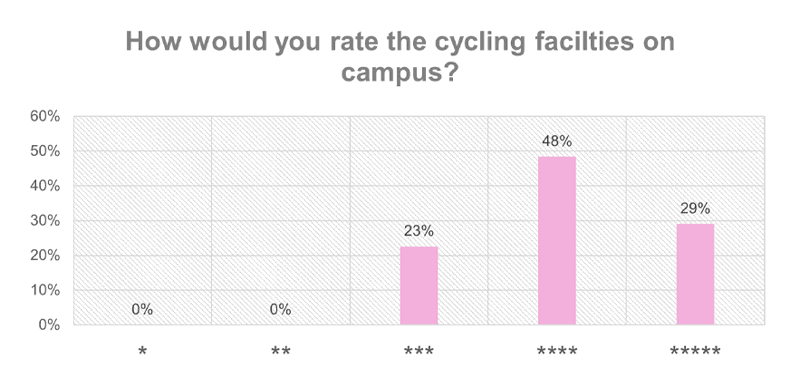
Figure 5.4: Cycling Facilities Rating
When asked what improvements could be made, the responses could be categorised as:
- Clothes drying facility: The university has previously applied for a clothes drying locker on two occasions and been unsuccessful, this should be investigated as a possible internally funded resource.
- Improvements to the shower / changing facilities: There is a capacity issue with the changing rooms that has been raised in previous travel surveys, the option to expand should be explored
- Maintenance Tools: The campus does have a cycle maintenance tool kit onsite at the reception desk, further promotion is clearly required.
- Safe Cycle Parking: The campus has individual bike lockers, keypad access bike sheds and standard bike racks on campus. There have been cases of bike theft on campus however, and so programmes like a lock exchange, bike marking and increased surveillance should be revisited.
- Route Awareness: Signage, posters, leaflets and led rides could all work to increase route awareness on campus
- Improved locker request system: The security team is currently working to update a series of locks on the active travel lockers to be ID card swipe access SALTO locks, removing the need to be assigned a key or the issue of lockers being un-used by assigned.
- Dropped kerb access to campus: A request was made for the kerb between campus and the train station to be dropped across the width of the path, it is currently only dropped along a section of the width. This will be shared with the campus team.
5.5 Cycling Summary
In Summary, the majority chose a cycling commute due to the perceived health benefits, lack of direct emissions and enjoyment. Despite this, 36% only felt safe some of the time when cycling. When asked, 36% of those who cycled part, or all of their commute had access to a cycle path most/all of the way.
Of those that didn’t cycle it was this lack of safe, traffic free cycle routes that was most often cited as a deterrent. Specific mention was made to having to choose lengthy detours in order to have access to safer cycling routes.
Barriers, such as stairs and bollards, was also cited as a deterrent. As in previous years, mention was made to the lack of a bike gutter on the Brunstane Station bridge. This has been raised by the university with Scotrail in the past.
Weather was also a deterrent, with participants stating that in better weather or with better wet weather gear storage, they would cycle more often.
We asked about the facilities at QMU for cyclists, the majority rates them 4 or 5 stars. However, improvements were required in the changing facilities and storage.
Lastly, it was felt that promotion of the cycling facilities on offer at QMU need better promotion, particularly amongst new staff and students who started since the Covid-19 pandemic. Due to operational reasons the university did not benefit from a Campus Cycling Officer (CCO) for the first part of the academic year 2020-2021. It is hoped that the presence of a full-time CCO intern, arranging and promoting active travel initiatives, will help increase awareness of the university’s facilities over the coming academic year.
6. Bus travel
The following section outlines the findings from those who commuted by bus as their primary or secondary mode of travel.
6.1 Reason
When asked why they chose to travel by Bus, participants most often stated:
- Cost of travel
- Time Taken
- Lack of an alternative
Only 7% stated it was due to enjoyment, compared to 70% of those that cycled. 12% stated ‘other’ reason. These included:
- Weather
- Injury
- Convenient service: Door-to-door
The full results are shown in Figure 6.1
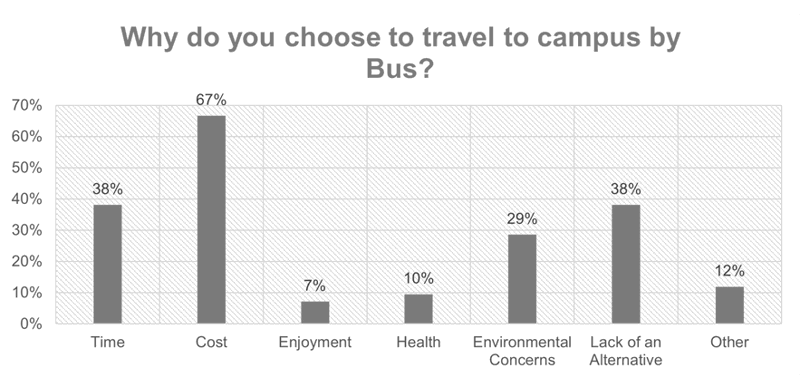
Figure 6.1: Bus Travel Motivation
6.2 Service
All bus users were asked to specify what service they used, the majority, 55% use the Lothian Buses service 30. The results are shown in Figure 6.2.
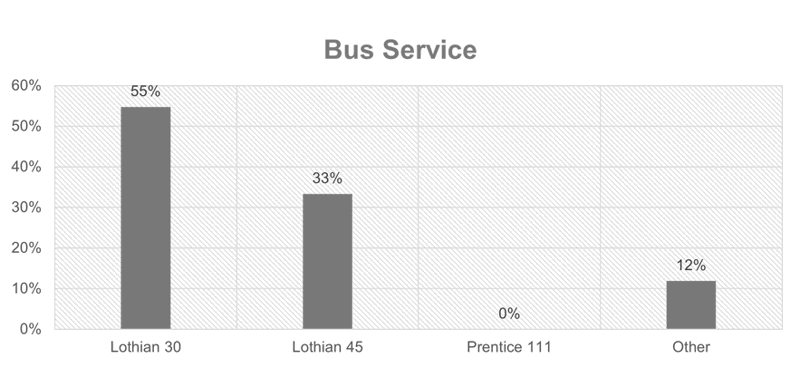
Figure 6.2: Bus Services
Of those that stated ‘other’, the services used where:
- Lothian Buses service 26
- East Coast Buses service 140
- First Bus
- Lothian Buses service 11
Figure 6.3 shows the routes of the cited services

Figure 6.3: Local Bus Routes
6.3 Bus Facilities
All bus users were offered a free type box to specify what would improve the bus service. Responses ranged from cost of services - particularly for those over 22 and later services, to more direct routes and more capacity. Following on from the Covid-19 pandemic, bus users also had concerns around on-board safety and mask wearing as well as comments around bus times on campus coinciding with class end/start times.
6.4 Active Travel
All participants that travelled by bus as their primary or secondary mode of travel were asked to state what, if anything, could persuade them to travel by an active mode of travel. The most common responses were:
- Nothing it is impractical
- More traffic free cycle routes.
The full results are shown in Figure 6.4
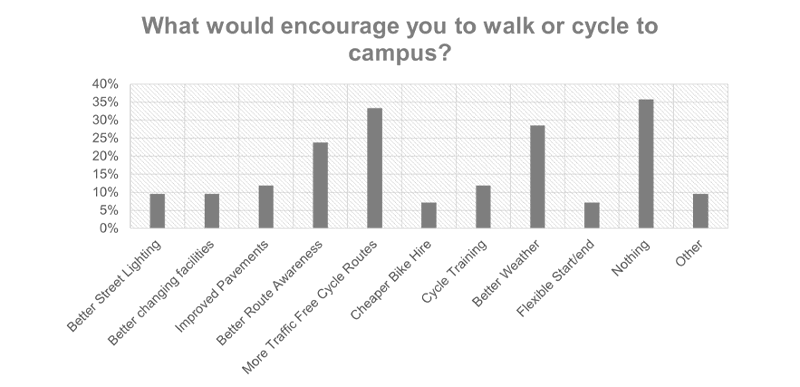
Figure 6.4: Motivating Factors for Bus Users
3 participants selected the ‘other’ option. Their reasons were:
- Distance
- Energy required
The average one-way commute for bus users was 6 miles for primary mode, with 21% commuting less than 5 miles – an achievable distance to cycle. The average one-way commute for bus users was 30miles for secondary mode, with 0% commuting less than 5miles.
6.5 Bus Summary
In summary, of those that completed all or part of their commute by bus, the majority chose this mode due to cost. It is assumed that as the cost of living and fuel prices rise, the bus will continue to be an affordable alternative to car or train, particularly for those under 22.
The majority travelled via Lothian service 30 or 45, both of which terminate on campus.
As with those already walking and cycling, participants stated that more traffic free walking and cycling routes would encourage them to partake in active travel. Bus users also wanted to see more reliable services, direct routes and earlier/later running services. When those travelling to campus by car were asked what would encourage them to use public transport a lack of convenience, frequency and reliability were all deterrents.
7. Train Travel
The following section outlines the findings from those who commuted by train as their primary or secondary mode of travel.
7.1 Reason
Participants were asked to select their primary motive for commuting to campus by train, the most common response was ‘Time’. Full results are shown in Figure 7.1.
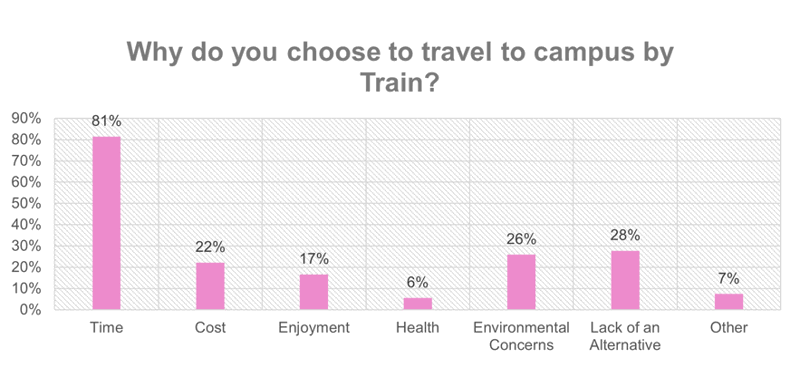
Figure 7.1: Train Travel Motivation
Those that stated ‘Other’ specified their reason as one of the following:
- Energy
- Weather
- Safety
In the 2020/21 survey, participants were asked the same question around the motivation behind their mode choice. Results were very similar, with time also the most common motive. However, the main difference was the ‘Environmental Concern’ motive. In 2020/21, only 1% cited it as a motive compared to 26% this year. This could be due to the COP26 being held in Glasgow, Scotland this year and increased prevalence of environmental concern in the media.
7.2 Combination
The most common combined modes of travel, featuring train travel, were train and walk at 36%. Figure 7.2 displays all combinations featuring train travel.
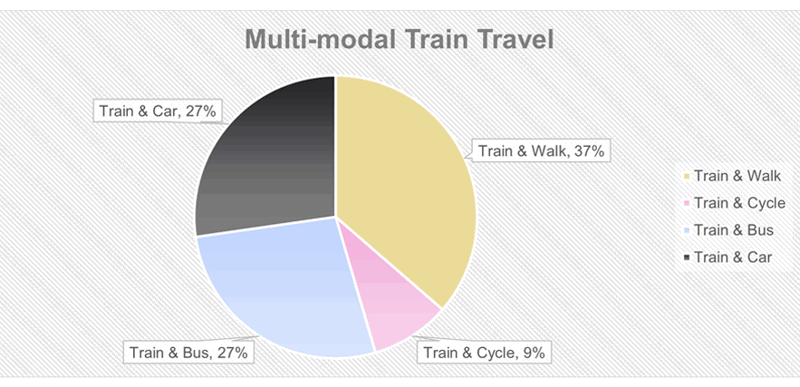
Figure 7.2: Multimodal Train Travel Combinations
7.3 Train Facilities
All participants who travelled by train for their primary or secondary mode were asked to specify how the service could be improved. Responses could be categorised as one of the following:
- Increased Frequency
- Earlier/later running times
- Reduced peak ticket cost/railcard usage at peak times
- Aligned with campus timetable
- Improved refund system
In order to encourage multimodal train travel, in combination with cycling, participants were asked whether there was sufficient space for a cycle on the train. 47% stated yes, while 43% stated sometimes. The remainder stated no.
7.4 Active Travel
All participants were asked to specify what would motivate them to use active modes of travel instead of train travel. The findings are shown in Figure 7.3.
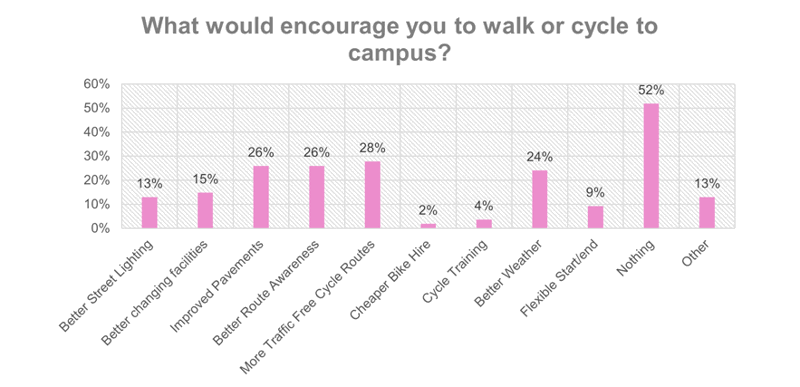
Figure 7.3: Motivating Factors for Train Users
As with the 2020/21 survey, traffic free routes and route awareness were the main solutions, alongside improved pavements. However, the most common, as with previous years, was ‘Nothing, it is impractical.
Of those that selected the ‘Other’ option, reasons were one of the following:
- Distance
- Energy Required
- Access to cycle equipment
7.5 Train Summary
In summary, of those that completed part or all of their commute by train, the majority did so due to time. A train from Waverley to QMU costs £3 and takes 7minutes, compared to a bus from Princes Street which costs £1.80 and takes 38minutes. This creates a trade-off between the importance of time or cost.
As with bus users, improved walking and cycling routes would encourage train users to use active travel.
Train users wanted to see more frequent trains, discounts-particularly on peak time train travel and train times more aligned with class timetables.
Improved convenience and discounted tickets were both cited by car users are factors that would encourage them to change their mode of travel.
8.0 Car Travel
Reducing the number of single occupancy is crucial to effectively reduce the campus transport emissions. The results from this section will be used to target promotions, understand the scope of change possible and to inform our research into campus scope 3 emissions, relating to commuting.
8.1 Reason
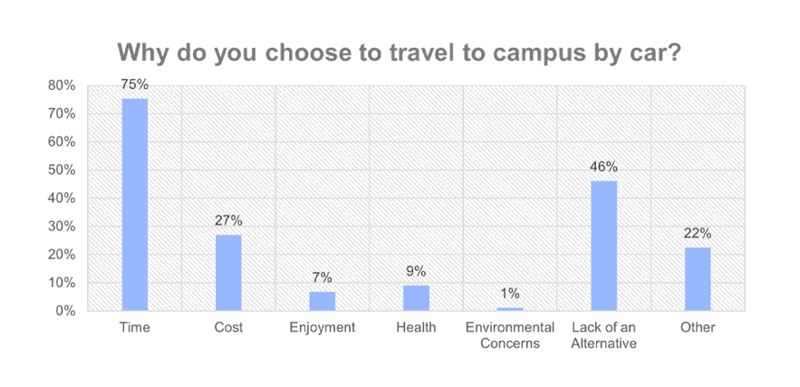
All participants were asked why they chose to travel by car for their primary or secondary mode of travel. The most common response was ‘Time’. This is echoed in previous years results and is also the primary motive for train travel.
The full results are shown in Figure 8.1.
Those that selected ‘Other’ chose one of the following reasons:
- Caring Responsibilities
- Load to carry
- Covid-19 Concerns
- Flexibility
- Car Sharing
- Distance
- Energy Required
8.2 Car Type
All participants who travelled by car were asked a series of questions surrounding their travel to help with emissions calculations and reporting.
8.2.1 Passengers
The majority travelled by car alone, 87%, with 4% driving with passengers and 9% being a passenger. Of those that did travel with passengers, the most common number of passengers was 1.
8.2.2 Fuel
The most common fuel type was petrol, followed by diesel, 10% used a hybrid or full electric vehicle. Full results shown in Figure 8.2.
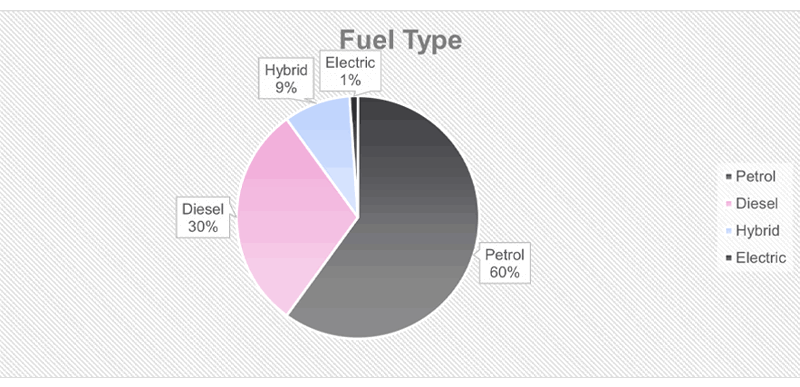
Figure 8.2: Fuel Type
Of those that had an engine, they were asked to specify size to assist with carbon calculations. The most common sizes were <1.4 Litre and 1.4-2.0 Litre.
8.3 Public Transport
Those that travelled by car were asked to specify what could encourage them to travel to campus by bus or train. The most common response was ‘More Convenient Services’ and ‘Increased Frequency’, demands echoed by those who already use public transport. The full results are shown in Figure 8.3.
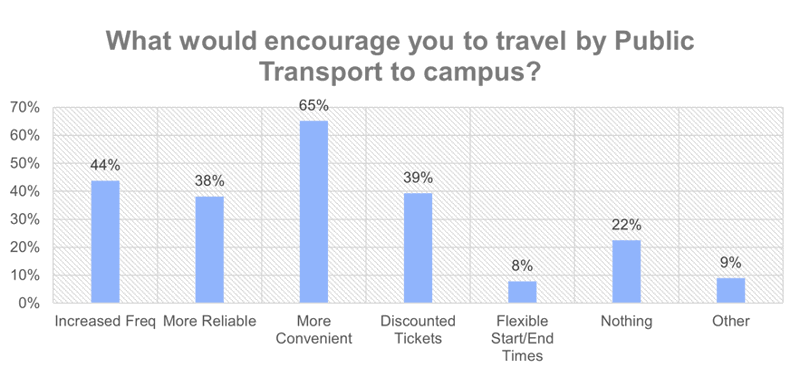
Figure 8.3: Motivating Factors for Car Users – Public Transport
Of those that stated ‘Other’, the motive was one of the following:
- Covid-19 Concerns
- Caring Responsibilities Support
- Reduced connections
8.4 Active Travel
Those that travelled by car were asked to specify what could encourage them to travel to campus by walking or cycling. The most common response was ‘Nothing it is impractical’, followed by ‘Traffic Free Routes’ and ‘Better Weather. The full results are shown in Figure 8.4.
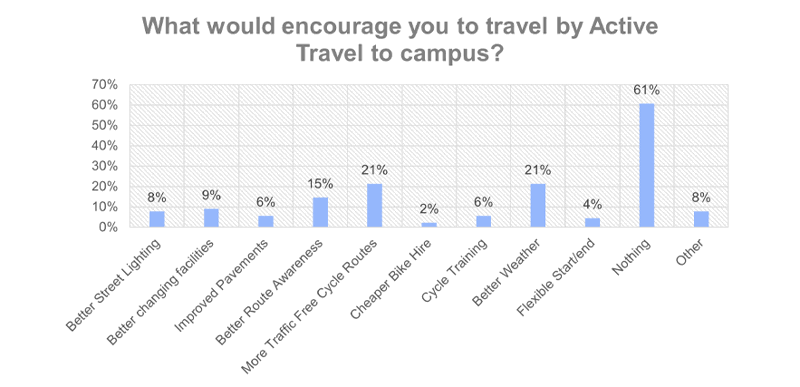
Figure 8.4: Motivating Factors for Car Users – Active Travel
8.5 Car Summary
In summary, the majority of those that travelled by car did so due to time, followed by nearly half citing a lack of an alternative.
The majority of those commuting to QMU by car did so alone, using a small/medium petrol car.
In the closing comments, several of those that travelled by car cited a want to travel by another means but the cost or lack of availability of services didn’t allow this. Many mentioned that connecting services were required when travelling to QMU from outside the city centre due to the Edinburgh centric routing of bus and train services. Lastly, other commitments such as childcare meant that having a car provided the required flexibility.
There was also demand for increased availability and promotion of EV charging on campus.
9. Other Travel
Participants were given the option to free-type their mode of travel if it was different to the options provided, modes of travel were:
- Ferry
- Kick Scooter
Participants were then asked why they selected this mode of travel. Those that travelled by Ferry cited a lack of an alternative and those that used a kick scooter cited enjoyment, health, cost and environmental concerns.
10. Working from Home
Following on from the long-term change to working habits as a result of the Covid-19 pandemic, the option to specify Working From Home (WFH), in place of a mode of travel, was provided.
Of those that did select WFH, 67% stated they intended to continue to do so for the foreseeable.
11. Active Travel Promotion
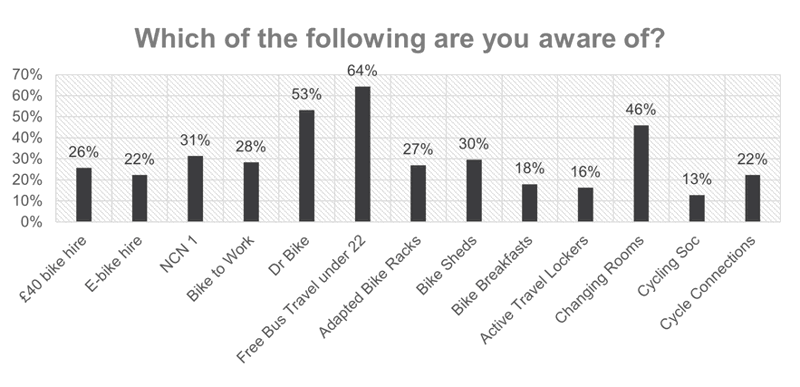
Figure 11.1: Scheme Awareness
Free under 22 bus travel in Scotland was the most recognised initiative. It is a national offering that came into place January of 2022.
It is hoped that through further promotion, inclusion in the survey and more regular events due to the easing of lockdown, the campus specific services will be more widely recognised.
Lastly, in support of an East Lothian Council funding plan, all participants were asked whether they would make use of an E-Cargo Bike. 22% stated they would.
12. Closing Comments
At the end of the survey, all participants were offered an opportunity to provide closing comment in a free-type box. All feedback will be relayed in full to the Campus & Facilities review, however comments can be categorised as one of the following:
- Bike Hire
- Bike Shed Security
- Bike to Work Scheme Limit
- Campus Footpaths
- Clothes Drying Facilities
- Communication / Promotion of events and services
- Cost of public transport
- Cycle Obstructions / Barriers
- Cycle Training
- Direct Routes for Active Travel
- Disabled Access
- Distance as a limitation
- EV Charging
- Lack of Alternative Travel Options
- Access and provision of lockers
- Public Transport Discounts
- Remote Working possibilities
- Safety
- Commuting Time
- Tools / Maintenance
- Weather
It is clear from the survey findings that the main barrier to active travel uptake is perceived time, safety and convenience. Several raised concerns over the energy required to undertake active travel while others noted the need for improved facilities on campus to allow for comfortable changing and safe storage of equipment.
13. Progress Made
Following on from the 2020/21 travel survey report, there were a number of points being considered for upcoming years, they were:
| Point | Status |
|---|---|
| Continuation of Dr Bike | Funding secured for next academic year |
| Campus Orienteering Event | Held event in collaboration with ELO and plans to host more in Freshers Week. |
| Increased use and audience of social media | Audience has increased, ongoing work. |
| Promotion of local routes | Signage installed on campus and investigating digital mapping |
| Parking Permit Review | Permits reviewed and strategy updated |
| Update of Travel Plan | Complete |
| Creation of Transport Strategy | Complete |
| Greater awareness of travel options amongst students | Awareness of Dr Bike increased slightly, however awareness levels of Bike Hire, the NCN and Bike to Work scheme all decreased on the 2019/20 and 2020/21 levels. |
| Paid Student Work Experience | 2-month Work Experience offered to recent QMU Graduate |
| Lobby to improve local services |
Lobbied council to grit path on Bauld Drive – ongoing. Worked with ELC to secure funding for new Pump Track in Musselburgh |
| Improve showering facilities |
Under review due to space limitations |
Table 13.1: Achievement of previous review points
During the 2021/22 academic year the following progress has been made:
- 7 staff/students took part in Walk Leader Training
- 8 people took part in Cycle Ride Leader Training
- Funding was secured for new bike parts for the hire fleet
- Funding was secured for Learn to ride, cycle ride leader, Dr Bike and Velotech training
- More than 20 bikes have been security marked by British Transport Police
- A Bike Breakfast was hosted on campus for 30 staff/students
- A short promotional film for Cycle Connections was created
- Planning has started to re-start the wellness walks
- Funding has been secured for new smart locks on active travel lockers
- A new promotional locker wrap has been installed
- 2 new banners have been installed on campus to promoted Cycle Connections.
Following on from the feedback received in the 2021/22 travel survey the following action plan is proposed:
- Improvements to the changing and shower facilities for staff and students.
- Promotion of Active Travel events and schemes to surpass pre-pandemic awareness levels.
- Re-apply for clothes drying facilities.
- Improve promotion and access to lockers for staff and students.
- Liaise with local bus companies and Scotrail on frequency and cost of tickets.
- Promote / Map / Video safe walking and cycling routes to campus.
- Create an accessibility strategy for Active Travel at QMU.
- Run 2nd Hand Bike Sale on campus.
- Run Cycling/walking event on campus.
- Offer cycling confidence training to staff and students.
- Increase rates of active travel amongst staff from 30% to 32%.
- Increase rates of active travel amongst students from 14% to 16%.