QMU Travel Survey Report 2020/2021
1 Introduction
1.1 Background
Queen Margaret University (QMU) is committed to promoting sustainable and responsible travel behaviour through ongoing Travel Planning, Parking Management and the promotion of Active Travel. To continually improve the conditions at QMU in relation to sustainable travel, annual monitoring of travel behaviour is undertaken to determine actual travel characteristics. This information is analysed, and the results are used to inform future targets and the appropriate allocation of resources.
Sweco were commissioned by QMU to undertake the 2020/21 travel survey for their campus in Musselburgh, East Lothian. The findings of the survey will be used to monitor the effectiveness of the Travel Plan, develop the Travel Plan further, and set future mode share targets.
The travel surveys are typically carried out annually at QMU; the 2020/21 survey was undertaken in February/March 2021. There will be reference to past travel survey results throughout this report.
During the 2020/2021 academic year the Covid-19 pandemic meant that restrictions on movement and in person teaching was in place. Public Transport operated at a reduced capacity and the service 45 was not operational for most of the year. The university car park remained open and parking charges were lifted for the academic year due to the exceptional circumstances.
1.2 Report Structure
The content of this report is structured as follows:
- Chapter 2 – Analysis of the Travel Survey questions and methodology;
- Chapter 3 – Summary of the results from the 2020/21 Travel Survey;
- Chapter 4 – Scope 3 Commuting Emissions
- Chapter 4 – Progress made; and
- Chapter 5 - Summary of report
2.0 Analysis of 2010/21 Travel Survey
2.1 Survey Context
Guidance was taken from previous travel surveys undertaken by Sweco for QMU in developing the 2020/21 survey, however due to the Covid-19 pandemic, questions have been tailored to reflect the changing circumstance and possible change in travel habits. Due to the reduction in face-to-face teaching and time on campus the survey had to be advertised solely online and via email.
Surveys from earlier years were found to be too time consuming for participants, with some surveys consisting of up to 40 questions. To create a simpler and more effective survey for participants, in 2013 the Travel Survey was designed to contain 24 questions divided into general demographic and then 5 key themes based on modal choice. Due to an increase in responses of almost 60% from 2012 to 2013, a similar format has been used in subsequent years, including the 2019/20 and now the 2020/21 survey. Additional questions were required this year to understand the changing habits as a result of the Covid-19 pandemic.
The survey ran for 6 weeks between the dates 01/02/2021 and 13/03/2021. The level of response was lower than previous years surveys at 221 responses. This has been attributed to being limited to solely online promotion of the survey and ‘survey fatigue’.
The survey was set up such that respondents answered general and demographic questions, they were then able to answer questions relevant to their chosen mode. Finally, participants had the opportunity to make any further comments and supply a staff or student email address to be included in a cycling monthly mailer or for entry into a prize draw to win an East Lothian £100 voucher, which acted as an incentive to increase the number of survey responses. The relevant section topics are listed below:
- General information and mode choice;
- Effects of Covid-19
- Walking facilities;
- Cycling facilities;
- Local Train Services;
- Bus Services to QMU;
- The use of private vehicles and QMU’s car share scheme
- Closing remarks
3.0 2020/21 Travel Survey results
3.1 General Result
The survey was open to both staff and students with the split being roughly 2:1 students/staff (very similar to in 2019/20), shown in Figure 1. Staff were more engaged with a higher proportion responding. Overall, there was a lower response rate than in previous years, which is attributed a less engaged community with limited/no face-to-face interaction.
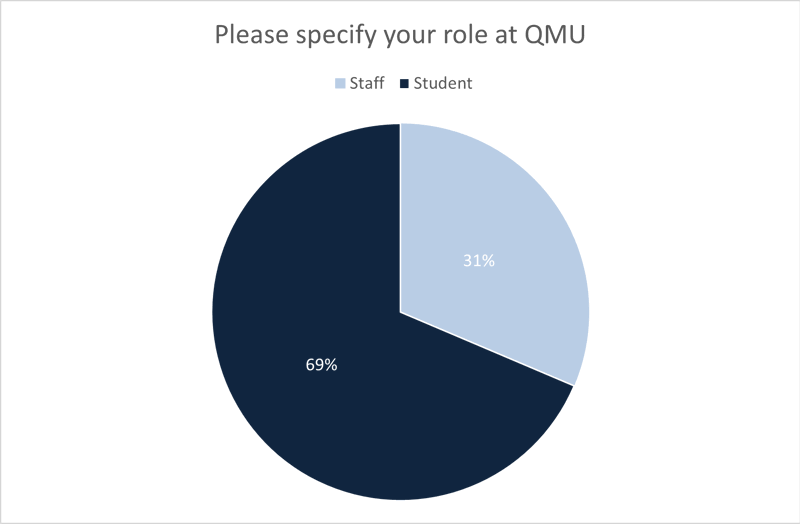
Figure 1: Split of staff to students completing the survey
Table 1 shows the percentage mode of all journeys and the number of journeys made per week by survey respondents and then weekly journeys scaled to the whole university. Both private car and active journeys increased in 2021 while public transport journeys decreased. This, alongside the drop in weekly total journeys, is expected to be a direct result of the Covid-19 restrictions during lockdowns which designated public transport for essential purposes only and increases in working remotely.
| Year | %Car | %Public |
%Active |
|---|---|---|---|
| 2019 | 28% | 54% | 17% |
| 2020 | 27% | 49% | 21% |
| 2021 | 34% | 42% | 34% |
| Year | Total Journeys Per Week | Scaled to whole university |
|---|---|---|
| 2019 | 1843 | 23546 |
| 2020 | 1661 | 21430 |
| 2021 | 284 | 6142 |
Table 1: Modal share per trip and total weekly trips
3.2 Time of Arrival/Departure
Students and staff were asked what times they usually arrive and depart from the university. The results for arrival time were later than previous years, which may reflect the difference in reason for staff and students attending campus. Figure 2 shows the most common time of arrival was after 9am, with 72% of participants choosing this option.
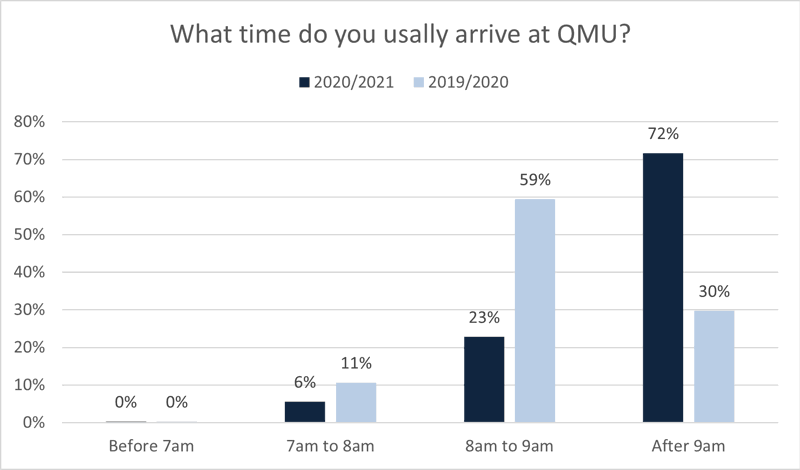
Figure 2: Arrival time of respondents
The departure time was more varied and showed departures over a wider period with people generally departing campus earlier than previous years, again reflecting the unique circumstances. Figure 3 shows the most common time with 45% of people leaving was before 4:30pm.
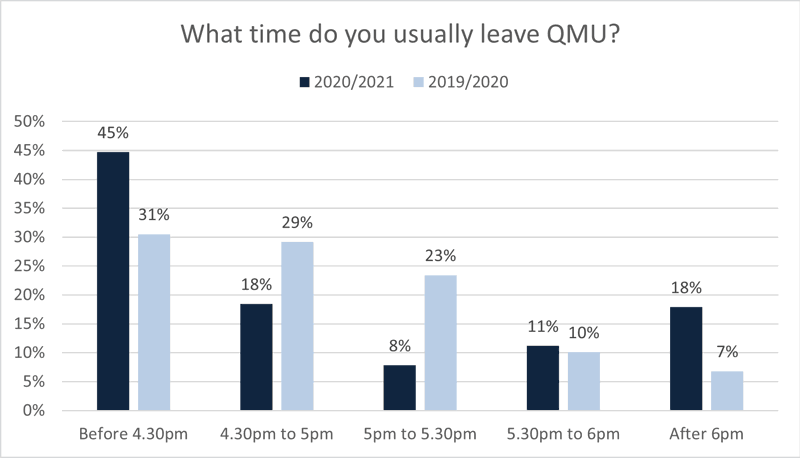
Figure 3: Departure times of respondents
It is worth noting that a modified timetable was in operation during the 2020/2021 academic year, with a focus on those courses with clinical or practical elements being prioritised to be in-person.
When analysing the response data it was clear that there had been some issues when entering arrival times with respondents selecting a.m. or p.m. erroneously e.g. departing campus at 5a.m. To avoid this in the future we would recommend that the time option is given in digital form instead of analogue.
3.3 Commute Distance
Survey participants were asked their average commute, one way. 17% had a commute of less than 5 miles, this group would be candidates for active travel. The remainder travelled more than 5 miles, this group would ideally use public transport or car share, possibly with active travel incorporated for the first and last miles. Figure 6 shows this distribution.
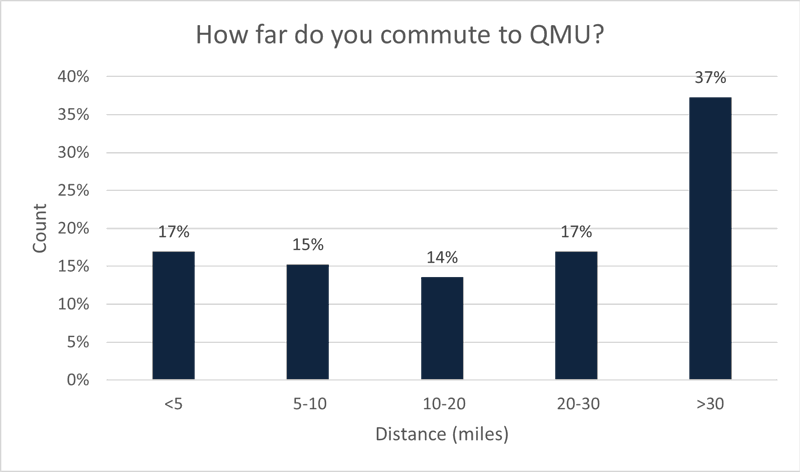
Figure 6: Commuting Distance in miles
As shown in Figure 6, a significant number (37%) of respondents lived over 30 miles from the university. It is recognised that these respondents are more likely to travel by car and encouraging longer public transport journeys is vital. It is also recognised that the high proportion of respondents living far away from the university may be as a result of students studying from home full-time/most of the time, and therefore staying at their family home, much further from campus.
3.4 Mode share for 2020/21
Students and staff members were asked both their primary and secondary modes of transport used to commute to and from Queen Margaret University. Due to the Covid-19 pandemic, mode shares have had a bigger shift than in previous years. The results of specific Covid-19 questions are provided in Section 3.10.
The primary mode share showed 20% of people were working from home. For comparison purposes these have been excluded from analysis. Public Transport remained the primary mode with 36% using it, this is a 14% drop from 2019/2020, likely to be a safety concern of using public transport during the pandemic. Active travel saw a large growth in uptake from 21% to 30%. Driving has also increased, however at a lower rate, increasing from 29% to 35%.
These results demonstrate a reluctance to use public transport and a possible impact of the service 45 not being in operation, however they also show an encouraging low rise in car use considering the relaxation of car park restrictions.
This year survey primary mode share results can be seen in Figure 7 alongside 2019/2020 survey results for comparison.
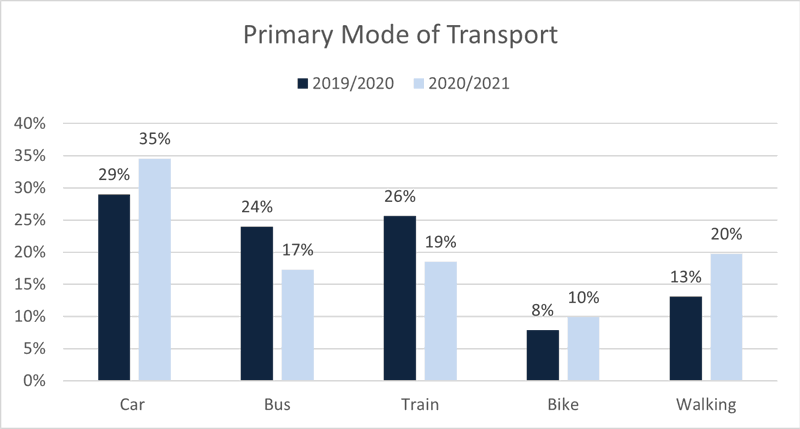
Figure 7: Comparison of primary mode of transport.
17% of people recorded working from home as their secondary mode of transport, again this has been excluded from results for analysis. The remaining modes of transport show a similar outcome to the 2019/20 survey with public transport as the main option at 46%, as shown in Figure 8. However, there was a 14% increase in the rates of cycling from 2019/2020 to 2020/2021. This is likely a response to the national increase in rates if cycling due to lockdown and quieter roads alongside the likelihood that those that did continue to attend campus lived closer.
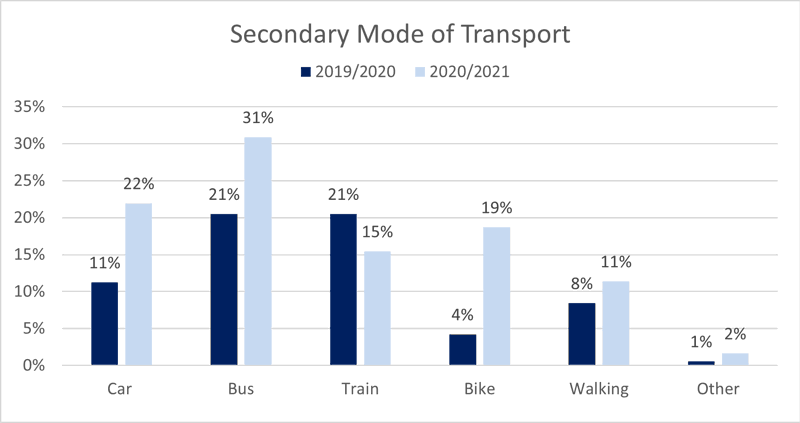
Figure 8: Comparison of secondary mode of transport.
Lastly, in order to determine accessibility, all participants were asked whether they had access to a road-worthy bike. There was a 10% increase from last year in those that did have a road-worthy bike, however it is still less than half. Increasing awareness and uptake of our bike hire scheme and further promoting our free Bike Dr service should increase access, Figure 10.
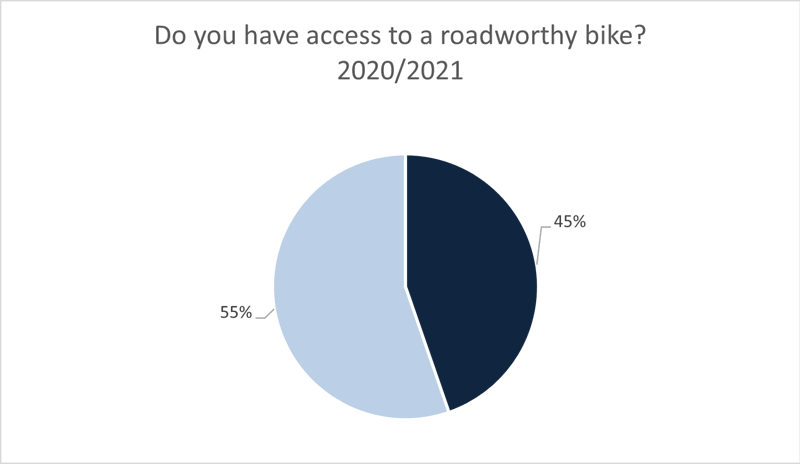
Figure 10: Access to a road-worthy bike
3.5 Walking
Those staff and students who walked as their primary or secondary mode of transport were then asked a series of walking specific questions. Firstly, they were asked why they chose to walk to QMU. The responses shown in Figure 11 show that the primary reason was the health benefits followed by cost.
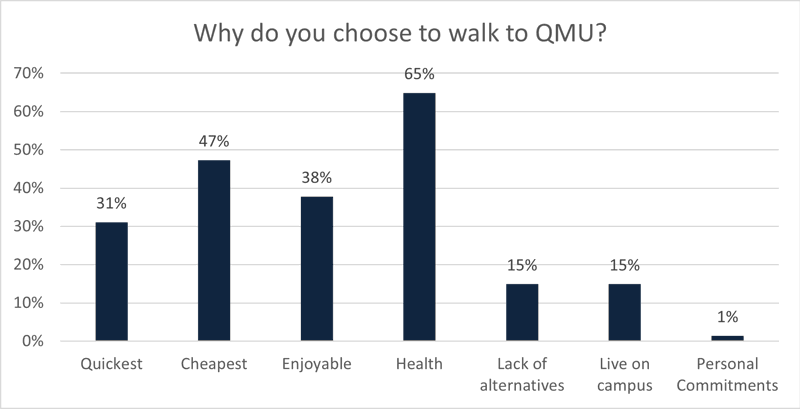
Figure 11: Reasons selected for walking to QMU
Of those that did walk, the majority, 51%, walked less than half a mile to reach campus, this correlates with the response of motive being for speed as for short journeys, walking can often be the quickest option. When comparing results from this years survey with the 2019/2020 survey there is a 20% increase in those choosing to walk more than 2 miles to reach campus. These results are shown in Figure 12. This change is likely due to concerns over using public transport and the more flexible work/class times resulting from the pandemic.
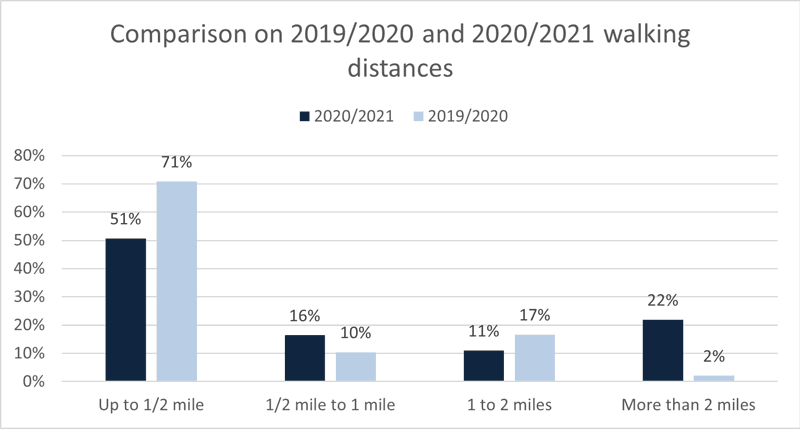
Figure 12: Distance walked to campus in miles.
The survey also revealed that the vast majority felt safe walking to campus (99%), a 3% increase from last year, and 97% rated their walking route “Good”.
3.6 Cycling
The percentage of people cycling has increased for another year with 10% using a cycle for their primary mode of transport. The proportion of those using a cycle as their secondary mode of transport has increased from 4% to 19% in the last year.
Those that selected cycle as their primary or secondary mode of transport were then asked as series of questions.
Firstly, they were asked why they chose to cycle. As with walking, the primary motive was health. Results can be seen in Figure 13.
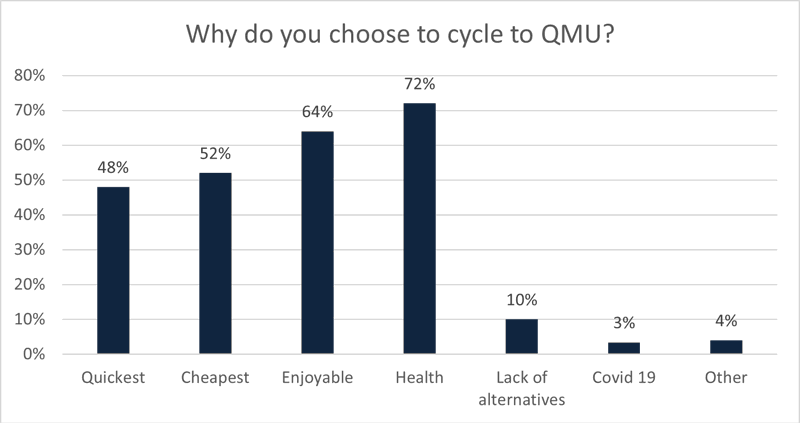
Figure 13: Reasons selected for cycling to QMU
Similar to walking, health was the top factor chosen by respondents as their motivation to use active travel. Enjoyment was also a motivating factor for 64% of people, this aligns with research that promotes the benefits of cycling for wellbeing as well as physical health.
Of those that cycled, 88% felt safe, this is a 12% increase from last years survey. This is likely due to quieter roads and increased infrastructure as a result of the pandemic. The increasing coverage of cycling in the media may also be having a positive effect on perceived safety.
Figure 14 shows the prevalence of cycle path usage for those traveling to QMU. 35% used a cycle path either all or most of the way, this is the same recorded in the 2019/2020 survey. However, there is a marked decrease in those that use a cycle path none of the way, from 58% to just 18%.
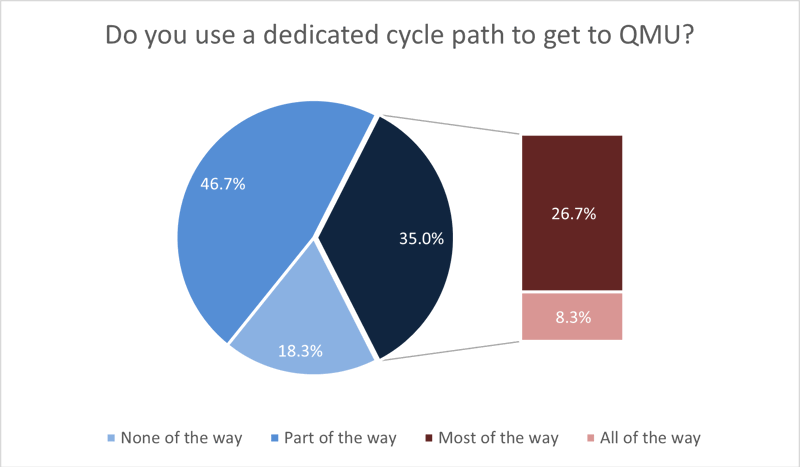
Figure 14: Cycle Path Availability
When asked how they would rate the facilities on campus for cyclists 86% stated they were “Good” or “Very Good”. The previous two years surveys recorded 95% and 92% of respondents stating “Good” or “Very Good”. Reference was made several times by respondents in the general comment section to the lack of space and facilities in the campus changing rooms. Access to changing facilities was limited during the peak of lockdown due to Covid-19 restrictions. There is, however, room for improvement in the academic buildings changing rooms and perhaps better promotion of the availability of the sports centres changing facilities is required.
All survey participants were asked about their awareness of several active travel schemes on campus. Figure 15 shows that there were high levels of awareness of the Just Eat Cycle hire bikes, this may in part be due to the promotion of the £10 student pass. There was a slight increase in awareness of the student bike hire scheme, however investment in promotional banners and increased use of the Cycle Connections logo on campus is expected to increase awareness further.
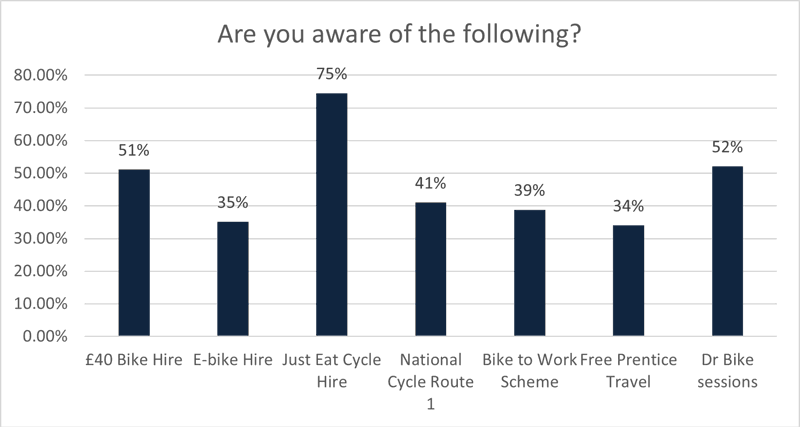
Figure 15: Awareness of Active Travel Schemes
As shown in Figure 15, more promotion of the free travel on Prentice Buses is necessary, as this was the scheme with the lowest awareness level at 34%.
3.7 Train Travel
Figure 16 shows the primary motives for choosing to commute by train. Time was the main reason for 85% of people followed by having a lack of alternatives. The location of QMU within 100metres of Musselburgh Train Station is likely a contributing factor.
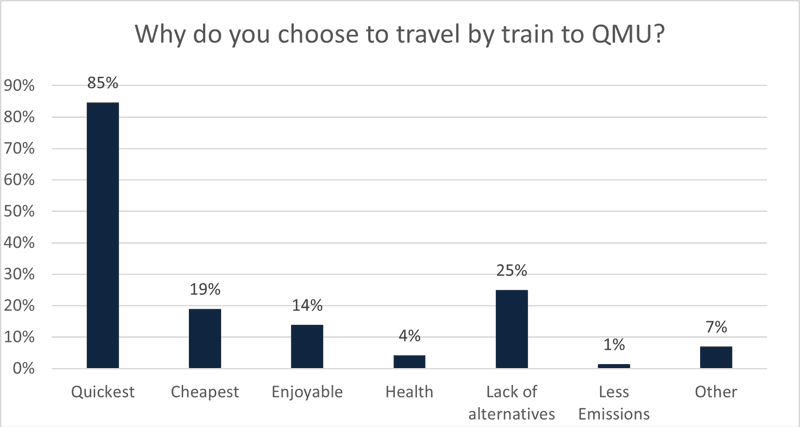
Figure 16: Ranking of improvements that could be made to local train services
80% of those who travelled by train walked to their origin train station. Figure 17 highlights the methods suggested to increase the uptake of active travel for journeys to and from stations. Traffic free routes and better awareness of routes was cited as the top methods by 28-29% of train users. Route planning support and promotion of route making apps such as Cycle Streets could help increase awareness of safe routes throughout the central belt and borders
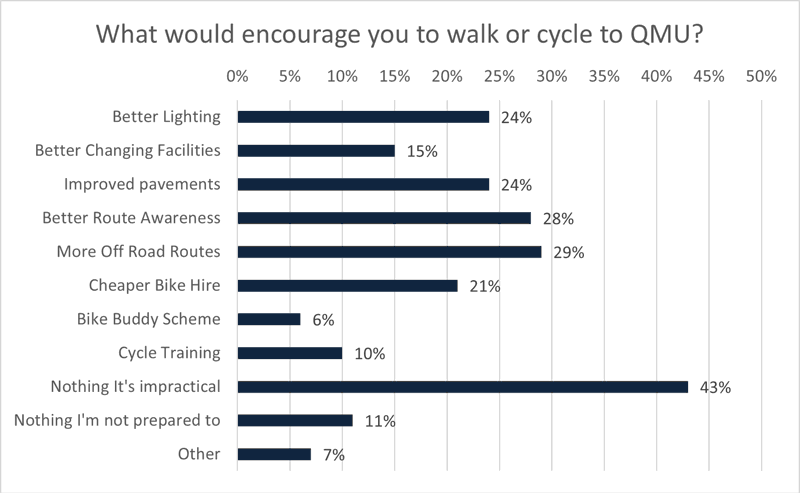
Figure 17: Methods to encourage active travel uptake
3.8 Bus Travel
The Lothian buses service 30 was the most common bus service, Figure 18, used by 64% of bus users, inline with previous years usage. The Lothian buses service 45 dropped by more than half from last year to just 24%. This is due to the service 45 not running a service for the majority of the year due to the Covid-19 pandemic. Despite being free to students and promotion, the prentice 111 still accounts for just 1% of bus journeys to campus, which may partially be down to awareness.
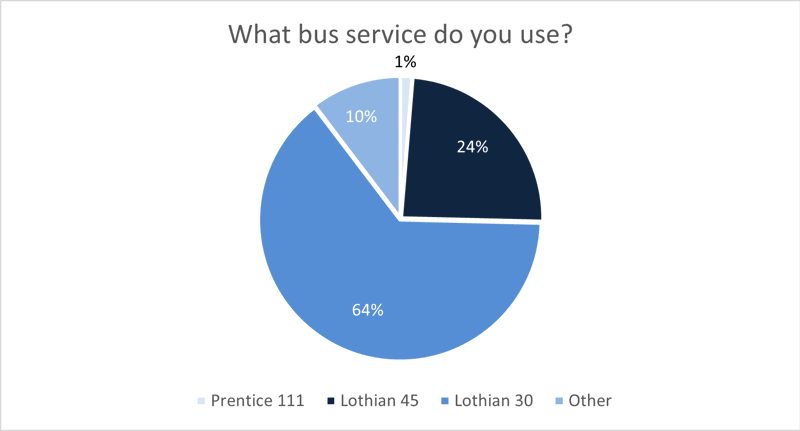
Figure 18: Most commonly used bus services
Unlike train users, bus users cited affordability as the key reason they choose that method of travel, Figure 19. 33% cited a lack of alternatives, this suggests that there is an opportunity to promote active travel and assist with supplying equipment, as well as hinting at a perceived lack of transport accessibility, either in terms of services, affordability or awareness.
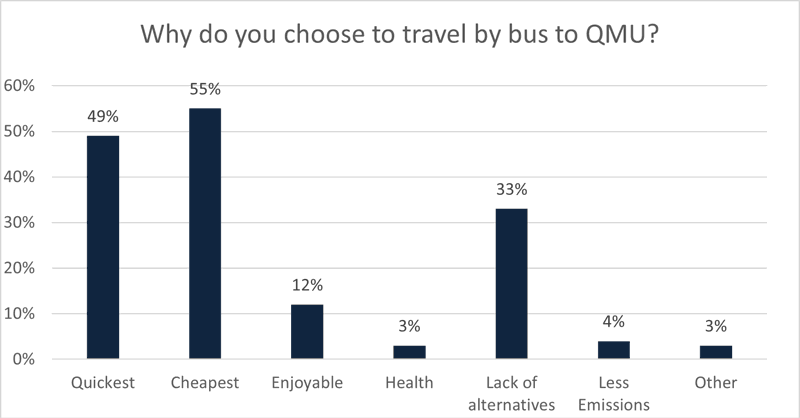
Figure 19: Reasons to travel by bus
Again, respondents were asked what would encourage them to choose active modes of travel to and from bus stops, Figure 20.
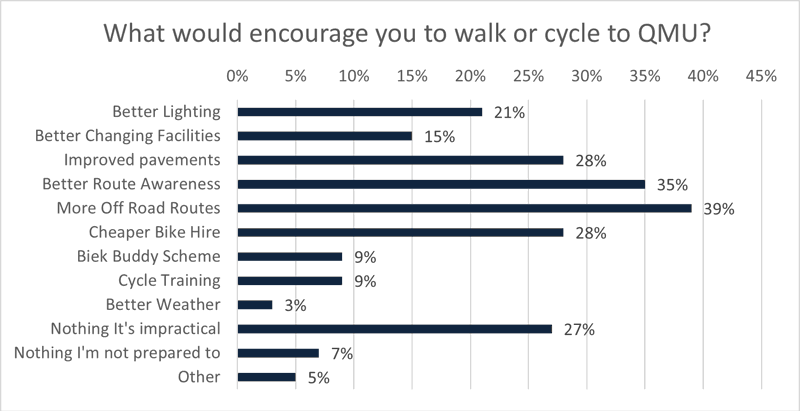
Figure 20: Methods to encourage Active Travel uptake
Similarly, to the train services, increased awareness and availability of traffic free routes was the main method. Less respondents felt it was impractical compared to train users, however it still accounted for 27% of respondents.
3.9 Car Travel
Reducing the number of single occupancy is crucial to effectively reduce the campus transport emissions. The results from this section will be used to target promotions, understand the scope of change possible and to inform our research into campus scope 3 emissions, relating to commuting.
All participants that used a car as their primary or secondary mode of transport where asked why they chose this method, Figure 21. The majority, 77%, stated it was due to time. The 2nd most cited reason was a lack of alternatives. Efforts should be made to explore acceptable alternatives for that 50%, whether it be car sharing, multimodal trips which incorporate active or public transport or flexible working arrangements. This result is unsurprising considering the high proportion of staff and students living over 30 miles from campus
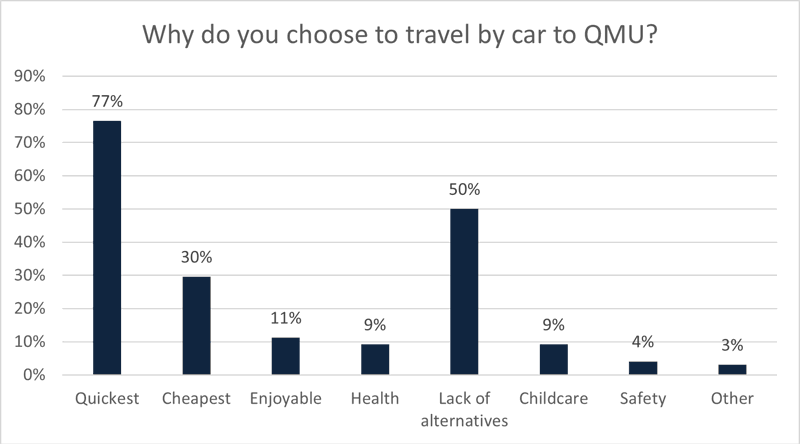
Figure 21: Reason for traveling by car
There has been a 6% decrease in solo car journeys this year, this reduction brings rates back in line with those in the 17/18 survey of 28%. The first question to car tackles how we could reduce this. The primary measures that would encourage the use of public transport was discounted tickets and increased frequency of services. When asked what would encourage drivers to use active travel to commute, 57% stated it was impractical. The full results are shown in Figures 22 & 23.
83% of all respondents commuted more than 5 miles to QMU. This suggests that active travel may not be suitable for those and that car sharing and quality public transport is the solution to reduce single occupancy car journeys.
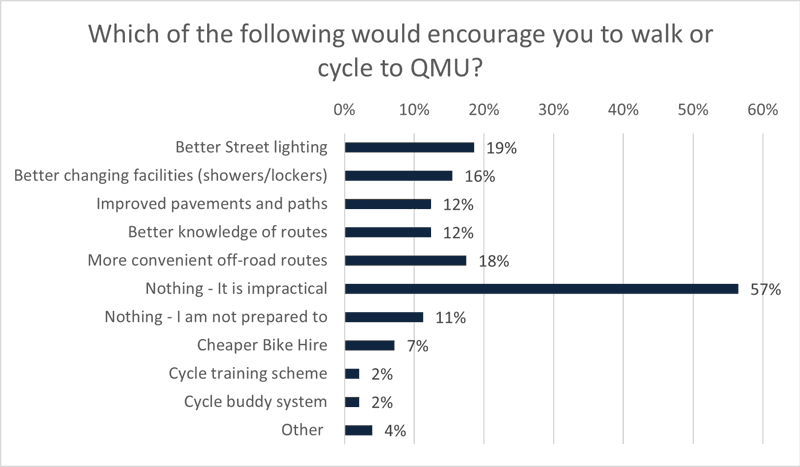
Figure 22: Methods to encourage uptake of Active Travel
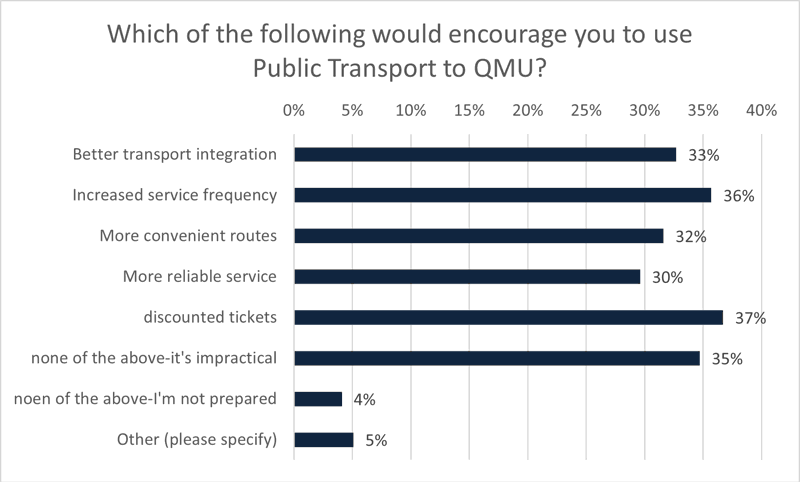
Figure 23: Methods to encourage uptake of public transport
63% surveyed were aware of the QMU LiftShare scheme, Figure 24. This is 9% reduction on last years results but still a considerable increase on previous years. It is worth noting that due to Covid-19 government guidance, car sharing was discouraged and promotion was stopped for a period of time. This will have had a direct effect on the number of single occupancy car journeys.
The survey provided a link to QMUs LiftShare page within the question, this is anticipated to have increased awareness further. Concerns were raised around traveling with strangers, this could be alleviated through the promotion within departments or courses so that participants felt they had a greater awareness of who they were travelling with. The reduction is expected to be due to the lack of on campus working or learning meaning that communing methods did not have to be looked into.
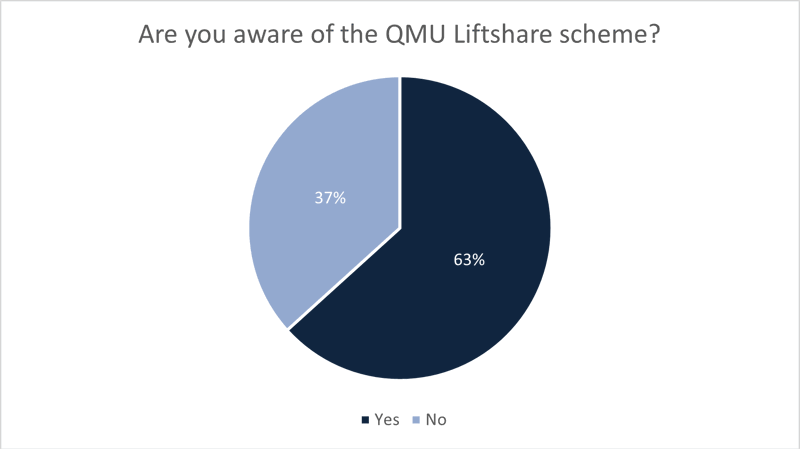
Figure 24: Awareness of Liftshare
Figure 25 shows the distribution of car parking for QMU. The 2017/2018 survey revealed that only 37% of drivers parked in the QMU car park, this was due to high numbers of staff and students parking in the local area. Since then campus parking has increased significantly with 73% in 2019/2020 and 81% in 2020/2021 using the car park.
The drop in people parking the train station and local area is expected to be due to talks held with Scotrail, East Lothian Council and the Police as well as partly due to the lifting of parking charges due to the Pandemic.
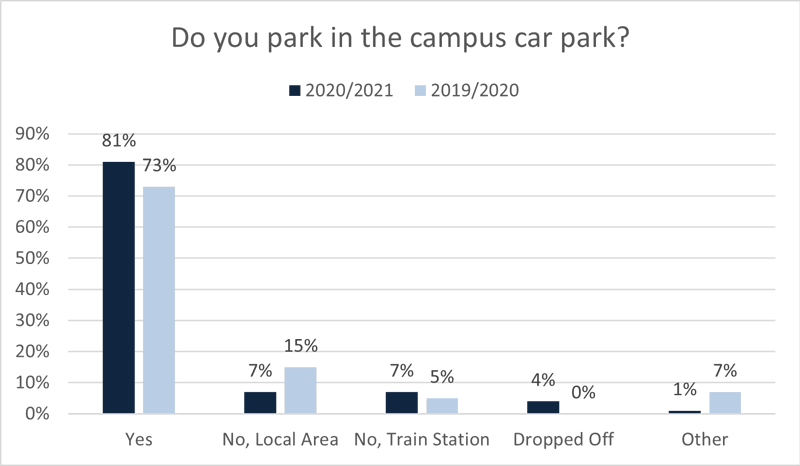
Figure 25: Parking distribution
19/20 was the first year that the survey asked car users about their vehicles fuel type and engine size. This was used to increase the accuracy of our scope 3 transport commuting emissions.
The majority of cars were petrol and the average engine size was less than 1.4l. 2% of car users had electric cars but none were recorded as hybrid. The full results can be seen in Figures 26 & 27.
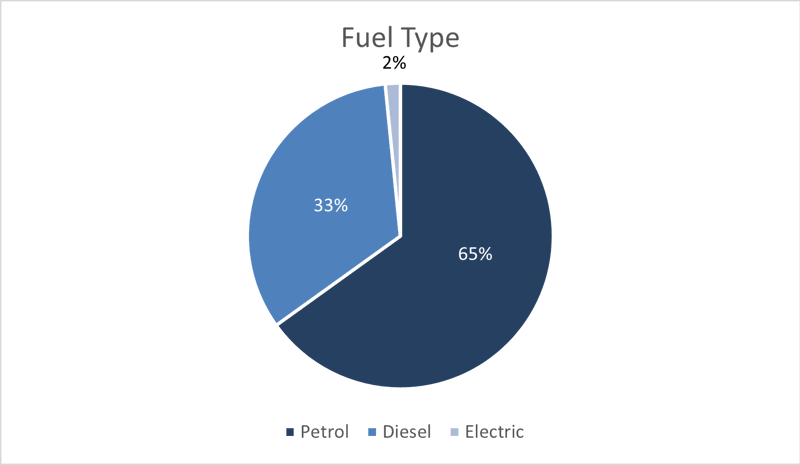
Figure 26: Fuel Type
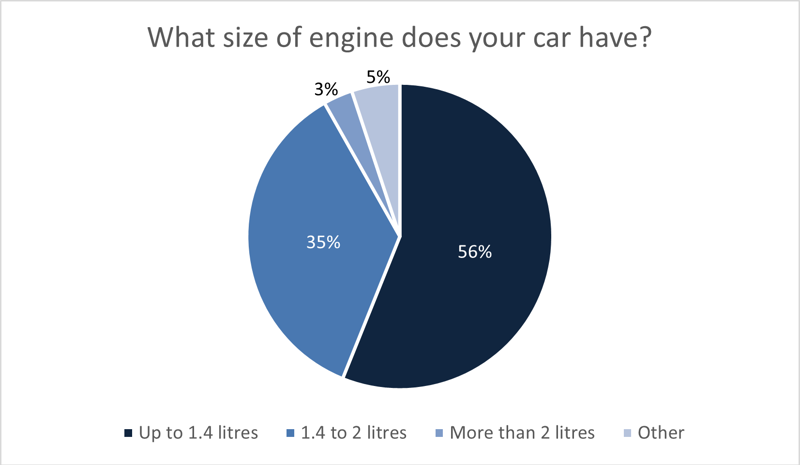
Figure 27: Engine Size
3.10 Effect of Covid-19 Pandemic on Commuting
In response to the Covid-19 pandemic, this years survey had additional questions to gauge the short and long term effect on commuting habits.
To determine the effect of the pandemic or work/study habits respondents were asked to specify which days they were on and off campus, Figure 4. Working and learning off campus was the dominant location for all days of the week. Mondays remained the quietest weekdays on campus and Wednesdays the busiest, this is inline with pre lockdown, however numbers on campus overall were considerably lower.
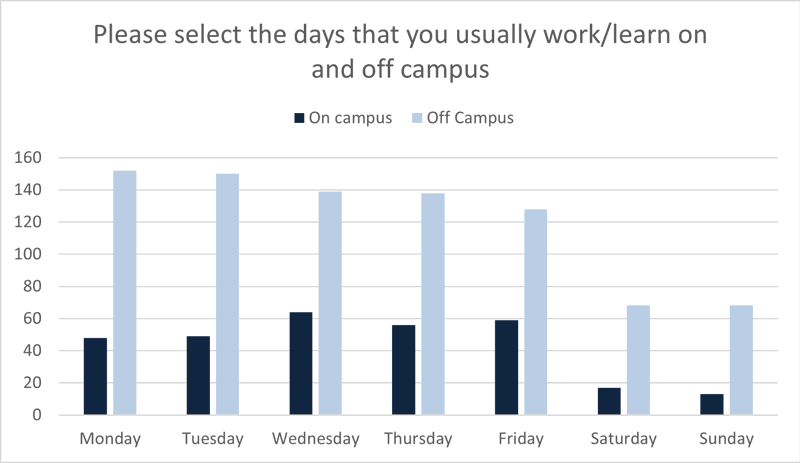
Figure 4: Work and Study Location
When respondents were asked how their work or study habits had changed the majority stated that since the first lockdown they have been studying or working from home 5 more days a week, indicating a switch from complete campus working/learning to complete home working/learning, Figure 5. Only 10% indicated they experienced no change, this would likely represent facilities and security staff who remained working on campus throughout the pandemic and students living on campus.
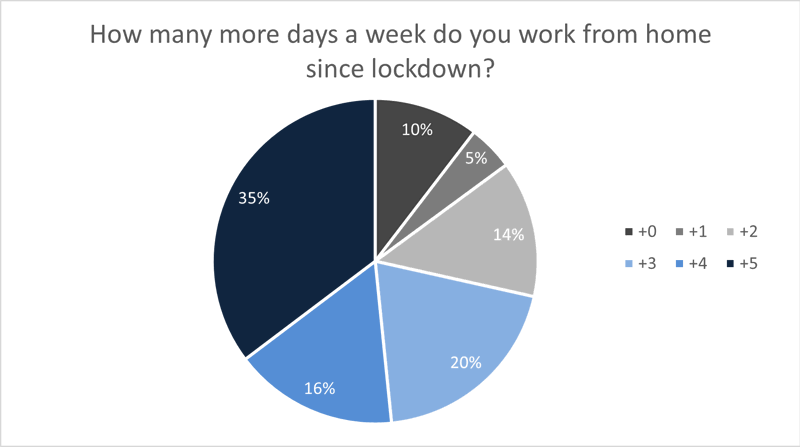
Figure 5: Effect of Lockdown on Work or Learning Location
44% of participants indicated that their mode of transport had changed since Lockdown, when asked why this was the primary reasons were safety concerns due to Covid-19, relocation and working from home more often.
Participants were asked whether they anticipated their commuting habits would change once Lockdown restrictions were lifted. 30% stated it would not change however, 23% indicated they would switch to active modes of travel and four participants stated they would be looking into an electric or hybrid vehicle.
Figure X shows the modal share that existed pre Covid-19 (2019/2020 survey results), during the Covid-19 pandemic and the anticipated modal share post Covid-19 pandemic (2020/2021 survey results).
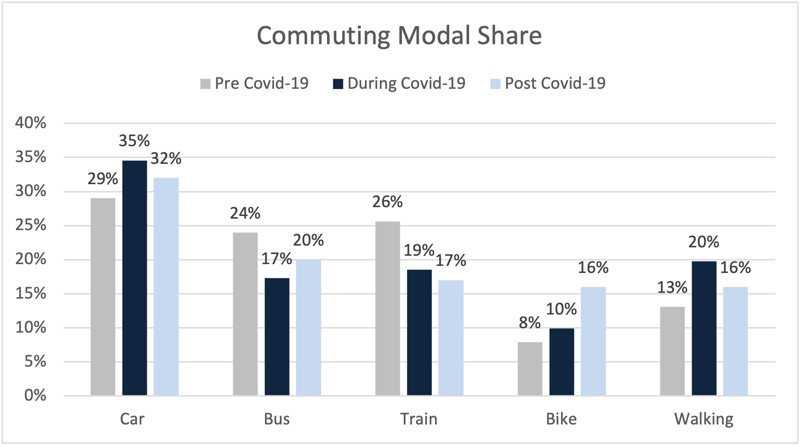
Figure X: Observed and anticipated modal share post pandemic
The results indicate a continuing demand for active travel alongside a 13% decrease in Public transport rates pre pandemic, this could suggest an anticipated lasting concern around shared transport. Although private car travel was suggested to decrease it is still above pre pandemic levels by 3%. It is important to bear in mind however that these are purely predictions made while still in the midst of the pandemic and so were likely swayed by existing concerns around transmission. Further improvements in Active Travel infrastructure and re instatement of public transport services may well see single car occupancy rates drop further than was noted by respondents.
The next question followed on from this, asking whether respondents felt comfortable using public transport at present. The results are shown in Figure 9. Research has suggested that well ventilated public transport with face coverings and social distancing has a low transmission rate however, with only 33% feeling confident that it is safe, work is required to put concerns at ease to ensure that car use doesn’t increase in the long term as a consequence.
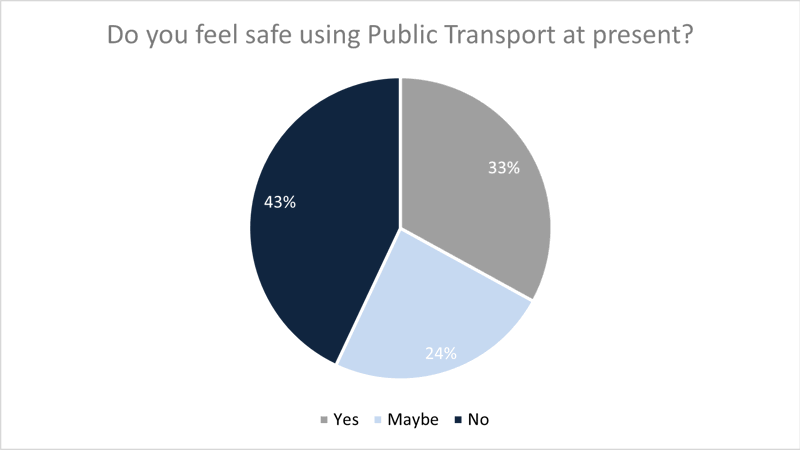
Figure 9: Perceived safety on Public Transport
3.11 Closing Comments
All survey participants were given the chance to provide further comment, 23% of participants did.
Several comments mentioned a discount for public transport for staff and students as well the need for more frequent services. Several comments made mention to the halting of the bus services onto campus and concerns that this was a permanent measure. Bus services will access campus as normal next semester, once the temporary vaccine centre is removed. The confusion around this suggests that changes to transport services need better promotion in the future.
Several people expressed a desire to walk or cycle more but felt there was a need for more traffic free routes or support to find existing routes.
There was a suggestion to increase the flexibility of the parking permit to support those wanting to switch between driving and alternative methods. By creating a multi-day pass car users could have the flexibility to buy parking permits in bulk and so save money, without being restricted to how many days a week it should be used. This would avoid the feeling of needing to use the car to validate paying for parking on that day.
Lastly, several comments supported the work being done by the transport team and were happy with the service being provided. Comments suggested the importance of having dedicated members of staff available to run events, get advice from and manage the transport at campus. There was the suggestion that the services should be better promoted however, especially to new staff and students or during the ‘Welcome Week’.
4.Scope 3 Emissions Commuting
4.1 Overview
The data sourced from the Annual Travel Surveys has been used since 2019 to estimate the Universities Scope 3 Commuting Emissions. Scope 3 emissions are emissions resulting from activities from assets not owned or controlled by the university. Queen Margaret University is one of a handful of Universities in the UK currently reporting commuting emissions in their annual Public Bodies Climate Change Report. It is deemed important so as to encompass all emissions associated with the university and better understand the changes required.
4.2 Results
Table 2 highlights the Scope 3 Commuting Emissions in tCO2e per year, scaled up to represent the all staff and students based at the Musselburgh Campus. A negative percentage change indicates a drop in emissions and vice versa. There was a decrease in total emissions of 27% from the 2018/2019 survey to the 2019/2020, followed by a considerable decrease of 43% the following year. This level of reduction is primarily due to the majority of staff and students working remotely and so having no commute. The largest reduction in commuting emissions was seen amongst students, this is partly due to staff being more likely to remain working on campus, at least part time. It is expected that the first survey post lockdown will show a considerable increase in total emissions due to the reinstatement of on campus working for the majority.
| Emissions Category (tCO2e) | 2018/2019 | % Change | 2019/2020 | %Change | 2020/2021 |
|---|---|---|---|---|---|
| Total Commuting Emissions | 1764 | -27% | 1286 | -43% | 731 |
| Total Student Emissions | 1310 | -14% | 1127 | 49% | 576 |
| Total Staff Emissions | 217 | -27% | 158 | -3% | 154 |
| Average Emissions Per year per Student | 0.18 | +44% | 0.26 | -46% | 0.14 |
| Average Emissions Per year per Staff | 0.47 | -28% | 0.34 | -3% | 0.33 |
Table 2: Commuting Emissions per year
5 Progress Made
Following on from the 19/20 survey results, there were a number of points being considered for the coming years
- Increase awareness and promotion of cycling options and availability for QMU;
- Review of parking permit applications and pricing;
- Promote of Liftshare and cheaper permit options for those that use it;
- More work to inform new students on travel options
- Continue engagement with and promotion of the local public transport services;
- Promote Park and Ride services as well as options for multi-modal transport which incorporates one form of active travel;
- Continue to promote local cycle routes; and
- Develop existing partnerships with QMU degree courses as well as community groups and local schools.
Looking at the results and progress made in 2020/21 the following action has been taken:
- The staff and student hire bike fleets have been expanded. There were 4 new e-bikes funded by the Energy Saving Trust and 10 bicycles funded by Cycle Scotland
- A promotion with Just Eat Cycles was ran offering passes for 4 months for £10
- A group of students have been supported in the formation of a new Cycle Society
- 2 students and 2 members of staff have been enrolled on the Cycle Ride Leader Course thanks to funding from Cycle Scotland
- Signage promoting active travel has been increased on campus, in-part due to funding from Paths for All and Cycle Scotland.
- Work has started to promote Maggies Café as an Active Travel Café through the use of signage, stocking bike repair equipment and forming a partnership with the councils Brunton Café.
- More the 30 bikes have been security marked by British Transport Police in 2020/21
- Funding has been secured from Paths for All to create a short film promoting Active Travel at QMU
This work will contribute to continuing the prevalence of people commuting sustainably and support the universities Green Travel Plan. Along with the points raised above the following measures are being carried out to encourage this further.
- The Continuation Dr Bike sessions have been planned on campus for staff and students
- Campus orienteering events have been planned in partnership with East Lothian Orienteering to promote fitness and wellbeing on campus
- Using social media, especially Cycling Connections page to promote upcoming events and opportunities on the university campus
- Increased awareness and promotion of walking, wheeling and cycling options and availability for QMU
- Review of parking permit applications and pricing
- Development of a Travel and Transport Strategy
- More work to inform new students on travel options
- Offer paid Travel Champion roles to students to help promote Active Travel and run events
- Lobby to increase facilities outside of campus for walkers, wheelers and cyclists; and
- Improve showering and storage facilities for active commuters on campus.
6 Summary
This report has reviewed the responses of 220 staff and students to the 2020/21 Travel Survey. 72% of respondents used at least one form of sustainable travel (cycling, walking or public transport) or worked from home. This is inline with 18/19 and 19/20’s results and up 6% from 17/18’s. Rates of active travel increased while public transport fell. This was expected due to concerns around enclosed areas due to the Pandemic. However, now is a crucial time to ensure that those that switched to active travel feel supported to maintain the habit and that public transport is well promoted post pandemic.
6.1 Modal Split
Modal split is subject to fluctuations especially due to the turnover of students and the changing work and study habits due to the Pandemic. Car travel has become the main mode of travel for staff and students, but it is expected that as restrictions ease, public transport uptake will increase again.
It is also important to consider the long-term changes to working and studying brought about by Home Working. At present, 21% of respondents stated they work or study from home. This is expected to decrease in the next academic year but for those who maintain this, it will dramatically reduce many people commuting emissions and expenditure.
The percentage of walkers increased by 3%, taken it to 16% and the number of cyclists plateaued at 8%. To further encourage active travel, the university will expand it’s hire fleet, offer discounted summer hire and increase promotion of its facilities.
6.2 Future Work
Based on the 2020/21 survey results, the following points should be considered for 2021/22:
- Collaborate closely with Residential Team and Student Union to incorporate active travel into events and societies;
- Increase visibility in universities promotional materials
- Work with the disability team to create accessible active travel options for students
- Access funding to provide training and group events for walking, wheeling and cycling
- Promote new section of NCN 1 by campus
QMU Travel 2020/21
Version Control
| Ver | Date | Status | Reviewed | Approved |
|---|---|---|---|---|
| 1 | 21/05/2021 | Draft | CF | BL |
| 2 | 1708/2021 | Final | CM | BL |